HW2-Solutions
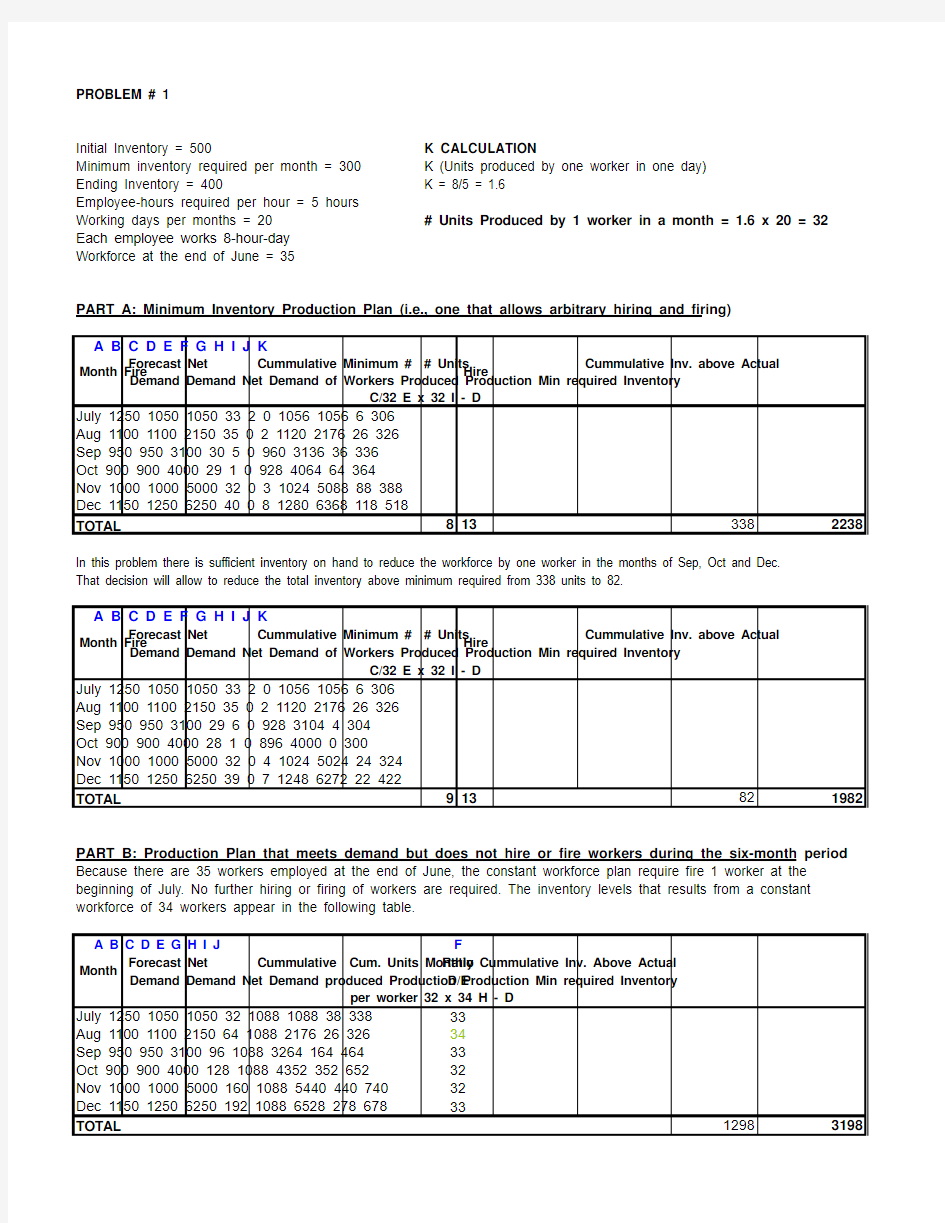
PART A: Minimum Inventory Production Plan (i.e., one that allows arbitrary hiring and firing) A B C D E F G H I J K
Forecast Net Cummulative Minimum # # Units Cummulative Inv. above Actual Demand Demand Net Demand of Workers Produced Production Min required Inventory
C/32 E x 32 I - D
July 1250 1050 1050 33 2 0 1056 1056 6 306
Aug 1100 1100 2150 35 0 2 1120 2176 26 326Sep 950 950 3100 30 5 0 960 3136 36 336
Oct 900 900 4000 29 1 0 928 4064 64 364
Nov 1000 1000 5000 32 0 3 1024 5088 88 388
Dec 1150 1250 6250 40 0 8 1280 6368 118 518
8 13 338 2238A B C D E F G H I J K
Forecast Net Cummulative Minimum # # Units Cummulative Inv. above Actual Demand Demand Net Demand of Workers Produced Production Min required Inventory
C/32 E x 32 I - D
July 1250 1050 1050 33 2 0 1056 1056 6 306
Aug 1100 1100 2150 35 0 2 1120 2176 26 326
Sep 950 950 3100 29 6 0 928 3104 4 304
Oct 900 900 4000 28 1 0 896 4000 0 300
Nov 1000 1000 5000 32 0 4 1024 5024 24 324
Dec 1150 1250 6250 39 0 7 1248 6272 22 422
9 13 82 1982A B C D E G H I J Forecast Net Cummulative Cum. Units Monthly Cummulative Inv. Above Actual Demand Demand Net Demand produced Production Production Min required Inventory per worker 32 x 34 H - D
July 1250 1050 1050 32 1088 1088 38 338Aug 1100 1100 2150 64 1088 2176 26 326Sep 950 950 3100 96 1088 3264 164 464Oct 900 900 4000 128 1088 4352 352 652Nov 1000 1000 5000 160 1088 5440 440 740Dec 1150 1250 6250 192 1088 6528 278 6781298 3198PROBLEM # 1
Month Fire Hire Minimum inventory required per month = 300
Ending Inventory = 400
Employee-hours required per hour = 5 hours
Working days per months = 20
Each employee works 8-hour-day
Workforce at the end of June = 35K CALCULATION K (Units produced by one worker in one day)Initial Inventory = 500
TOTAL
K = 8/5 = 1.6# Units Produced by 1 worker in a month = 1.6 x 20 = 32
In this problem there is sufficient inventory on hand to reduce the workforce by one worker in the months of Sep, Oct and Dec.
That decision will allow to reduce the total inventory above minimum required from 338 units to 82.
Month F
Month Fire Hire TOTAL
D/E
PART B: Production Plan that meets demand but does not hire or fire workers during the six-month period
TOTAL
32
32
33
Because there are 35 workers employed at the end of June, the constant workforce plan require fire 1 worker at the
beginning of July. No further hiring or firing of workers are required. The inventory levels that results from a constant
workforce of 34 workers appear in the following table.
33
Ratio 33
34
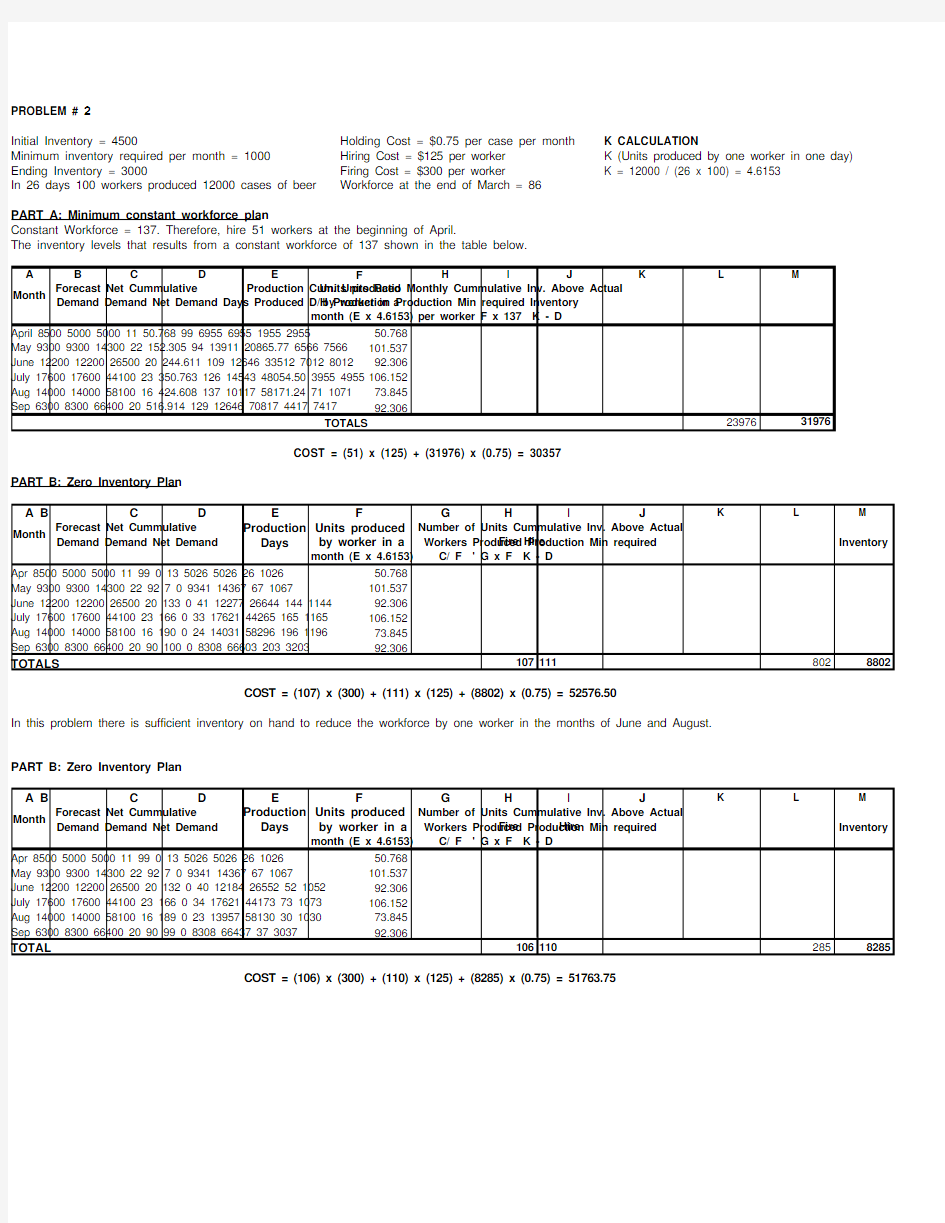
PROBLEM # 2
Constant Workforce = 137. Therefore, hire 51 workers at the beginning of April.
The inventory levels that results from a constant workforce of 137 shown in the table below.
In 26 days 100 workers produced 12000 cases of beer Holding Cost = $0.75 per case per month Initial Inventory = 4500
Ending Inventory = 3000
Minimum inventory required per month = 1000
PART A: Minimum constant workforce plan
COST = (107) x (300) + (111) x (125) + (8802) x (0.75) = 52576.50
PART B: Zero Inventory Plan
PART B: Zero Inventory Plan
K CALCULATION K (Units produced by one worker in one day)K = 12000 / (26 x 100) = 4.6153
Hiring Cost = $125 per worker Firing Cost = $300 per worker Workforce at the end of March = 86COST = (51) x (125) + (31976) x (0.75) = 30357
COST = (106) x (300) + (110) x (125) + (8285) x (0.75) = 51763.75
In this problem there is sufficient inventory on hand to reduce the workforce by one worker in the months of June and August.
PART C & D
LINDO INPUT
MINIMIZE
125H1+125H2+125H3+125H4+125H5+125H6+300F1+300F2+300F3+300F4 +300F5+300F6+0.75I1+0.75I2+0.75I3+0.75I4+0.75I5+0.75I6
SUBJECT TO
W1-H1+F1=86
W2-W1-H2+F2=0
W3-W2-H3+F3=0
W4-W3-H4+F4=0
W5-W4-H5+F5=0
W6-W5-H6+F6=0
P1-50.7692W1=0
P2-101.5384W2=0
P3-92.3077W3=0
P4-106.1538W4=0
P5-73.8462W5=0
P6-92.3077W6=0
P1-I1=4000
P2+I1-I2=9300
P3+I2-I3=12200
P4+I3-I4=17600
P5+I4-I5=14000
P6+I5-I6=6300
I1>1000
I2>1000
I3>1000
I4>1000
I5>1000
I6>3000
END
GIN W1
GIN W2
GIN W3
GIN W4
GIN W5
GIN W6
LINDO OUTPUT
OBJECTIVE FUNCTION VALUE
24445.35
VARIABLE VALUE REDUCED COST
W199.000000228.461395
W299.000000380.768982
W3158.000000276.923096
W4158.000000363.846039
W5158.000000410.769287
W6158.000000-230.769226
H113.000000 0.000000
H20.0000000.000000
H359.0000000.000000
H40.0000000.000000
H50.000000125.000000
H60.000000425.000000
F10.000000425.000000
F20.000000425.000000
F30.000000425.000000
F40.000000425.000000
F50.000000300.000000
F60.0000000.000000
I11026.1507570.000000
I21778.4522710.000000
I34163.0688480.000000
I43335.3696290.000000
I51003.0689700.000000
I69287.6855470.000000
P15026.1508790.000000
P210052.3017580.000000
P314584.6171880.000000
P416772.3007810.000000
P511667.6992190.000000
P614584.6171880.000000
I NTERPRETATION OF THE SOLUTION
Total Cost = $24445.35
Total # of workers in April and May = 99
Total # of workers in June, July, August and September = 158
Total # of workers hired in April = 13
Total # of workers hired in June = 59
Total # of workers hired in May, July, August and September = 0
Total # of workers fired in April, May, June, July, August and September = 0
Inventory at the end of April = 1026 cases of beer.
Inventory at the end of May = 1778 cases of beer.
Inventory at the end of June = 4163 cases of beer.
Inventory at the end of July = 3335 cases of beer.
Inventory at the end of August = 1003 cases of beer.
Inventory at the end of September = 9287 cases of beer.
Total # of cases of beer produced in April = 5026
Total # of cases of beer produced in May = 10052
Total # of cases of beer produced in June = 14584
Total # of cases of beer produced in July = 16772
Total # of cases of beer produced in August = 11667
Total # of cases of beer produced in September = 14584
P LAN FOR P ART B WOULD BE THE SAME AS FOR P ART D. (N O FIRING)
相关文档
最新文档
- 农业生态循环产业园项目建议书写作参考范文 (一)
- 生态农业观光园项目建议书
- 休闲农业生态园项目建议书写作参考范文 (一)
- 客户拜访总结表
- 对于意向客户要时时及时的跟踪(最新)
- 房地产类客户跟踪登记表
- 客户信息表(CPF)--表1
- 客户跟进表
- 客户拜访总结表
- 客户跟踪回访记录表
- 客户跟踪记录表范本
- 客户跟踪记录表(销售)
- 建材门店管理10大常用表格(门店一定要收藏)
- 跟踪客户记录表
- 全国翻译专业资格(水平)考试:2021三级笔译真题模拟及答案(3)
- 全国翻译专业资格(水平)考试:2022三级笔译真题模拟及答案(1)
- 全国翻译专业资格(水平)考试:2021三级笔译真题模拟及答案(5)
- 2022年6月CATTI三级翻译笔译实务真题及参考答案
- CATTI三级笔译综合能力真题及答案
- 翻译三级笔译实务-1_真题(含答案与解析)-交互