XU-RI_et_al-2008-Global_Change_Biology土壤

Terrestrial nitrogen cycle simulation with a dynamic global vegetation model
X U-R I*w and I.C.P R E N T I C E z
*Max-Planck Institute for Meteorology,D-20146Hamburg,Germany,w Institute of Tibetan Plateau Research,Chinese Academy of Sciences,Beijing100085,China,z QUEST,Department of Earth Sciences,University of Bristol,Bristol BS81RJ,UK Abstract
A global scale Dynamic Nitrogen scheme(DyN)has been developed and incorporated
into the Lund–Posdam–Jena(LPJ)dynamic global vegetation model(DGVM).The DyN
is a comprehensive process-based model of the cycling of N through and within
terrestrial ecosystems,with fully interactive coupling to vegetation and C dynamics.
The model represents the uptake,allocation and turnover of N in plants,and soil N
transformations including mineralization,N2?xation,nitri?cation and denitri?cation,
NH3volatilization,N leaching,and N2,N2O and NO production and emission.Modelled
global patterns of site-scale nitrogen?uxes and reservoirs are highly correlated to
observations reported from different biomes.The simulation of site-scale net primary
production and soil carbon content was improved relative to the original LPJ,which
lacked an interactive N cycle,especially in the temporal and boreal regions.Annual N
uptake by global natural vegetation was simulated as1.084Pg N yrà1,with lowest values
o1g N mà2yrà1(polar desert)and highest values in the range24–36.5g N mà2yrà1
(tropical forests).Simulated global patterns of annual N uptake are consistent with
previous model results by Melillo et al.The model estimates global total nitrogen storage
potentials in vegetation(5.3Pg N),litter(4.6Pg N)and soil(!67Pg as organic N and
0.94Pg as inorganic N).Simulated global patterns of soil N storage are consistent with
the analysis by Post et al.although total simulated N storage is less.Deserts were
simulated to store460Tg N(up to0.262kg N mà2)as NO3à,contributing80%of the global
total NO3àinventory of580Tg N.This model result is in agreement with the?ndings of
a large NO3àpool beneath deserts.Globally,inorganic soil N is a small reservoir,
comprising only1.6%of the global soil N content to1.5m soil depth,but the ratio has
a very high spatial variability and in hot desert regions,inorganic NO3àis estimated to be
the dominant form of stored N in the soil.
Keywords:annual N uptake,dynamic global N cycle model,inorganic N,N cycle,N storage,
nitri?cation–denitri?cation,terrestrial ecosystem
Received13November2006;revised version received9January2008and accepted8February2008
Introduction
A great deal of attention has been focused on the terrestrial ecosystem carbon budget and its potential development over a century time scale.Atmospheric measurements indicate a persistent terrestrial biosphere C sink,but the location and mechanisms of C uptake are still highly uncertain(Prentice et al.,2001;Houghton,2003;House et al.,2003).Understanding the mechan-isms responsible for the C sink and its large interannual variability is crucial for accurate projections of future concentrations of CO2in the atmosphere.A large anthropogenic increase in nitrogen deposition during the20th century has been proposed as a contributory effect but there is no consensus as to its magnitude (Holland et al.,1997;Houghton et al.,1998).It has also been argued that modelling results from current dy-namic global vegetation models(DGVMs)(Cramer et al.,2001;Prentice et al.,2001)exaggerate the terrestrial biosphere’s potential to slow atmosphere CO2rise be-cause ecosystem C accumulation may be constrained by
Correspondence:Xu-Ri,Institute of Tibetan Plateau Research,
Chinese Academy of Science,Beijing100085,China,tel.18610
62849535,fax1861062849886,e-mail:xu-ri@https://www.sodocs.net/doc/9a6211642.html, or
xingxuri@https://www.sodocs.net/doc/9a6211642.html,
Global Change Biology(2008)14,1745–1764,doi:10.1111/j.1365-2486.2008.01625.x
r2008The Authors
Journal compilation r2008Blackwell Publishing Ltd1745
N limitations that are not fully represented in or absent from the these models (Hungate et al .,2003).
This paper describes a process-based,dynamic global nitrogen scheme,DyN,derived in part from the existing N cycle models,DNDC (Denitri?cation–Decomposi-tion,Li et al .,1992),TEM (Terrestrial Ecosystem Model,Raich et al .,1991;McGuire et al .,1992)and Hybrid v3.0(Friend et al .,1997),and fully integrated into the Lund–Posdam–Jena (LPJ)DGVM framework (Sitch,2000;Smith et al .,2001;Sitch et al .,2003).
The DyN is designed to provide a global view of the terrestrial ecosystem N cycle and its possible reactions to global climate change,elevated CO 2concentration and N deposition.The model requires only a limited amount of external information to be speci?ed,while being global in scope and featuring full internally con-sistent dynamic coupling between C and N cycling processes.In this paper,we describe the structure of the model,present key ?ndings in terms of global quantities and patterns,and compare these ?ndings both with site-scale observations in different biomes and with previous model analyses at the global scale.
Model description
The LPJ DGVM
The LPJ is a state-of-the-art modelling framework for terrestrial ecosystem dynamics,which was developed jointly by a consortium of three laboratories (Lund University,the Potsdam Institute for Climate Impact Research and the Max Planck Institute for Biogeochem-istry in Jena)(Sitch,2000;Smith et al .,2001;Sitch et al .,
2003).These papers describe an extensive set of evalua-tion tests of the ‘baseline’version of LPJ against site-and global-scale observational datasets.However,this and all other current versions of LPJ still represent a ‘carbon-water-energy’model system.That is,the basic processes of photosynthesis,respiration,plant growth,establishment and mortality,competition among plant functional types (PFTs)and disturbance regime (?re)are explicitly simulated,but the model does not treat the coupled dynamics of C and N and the associate production of N-containing trace gases,nor does it account for the well-attested limitation of primary production by N cycling in temperate and boreal re-gions.By coupling C and N dynamics in the LPJ frame-work,we establish a ‘proof of concept’for the full inclusion of N processes in the next generation of DGVMs.
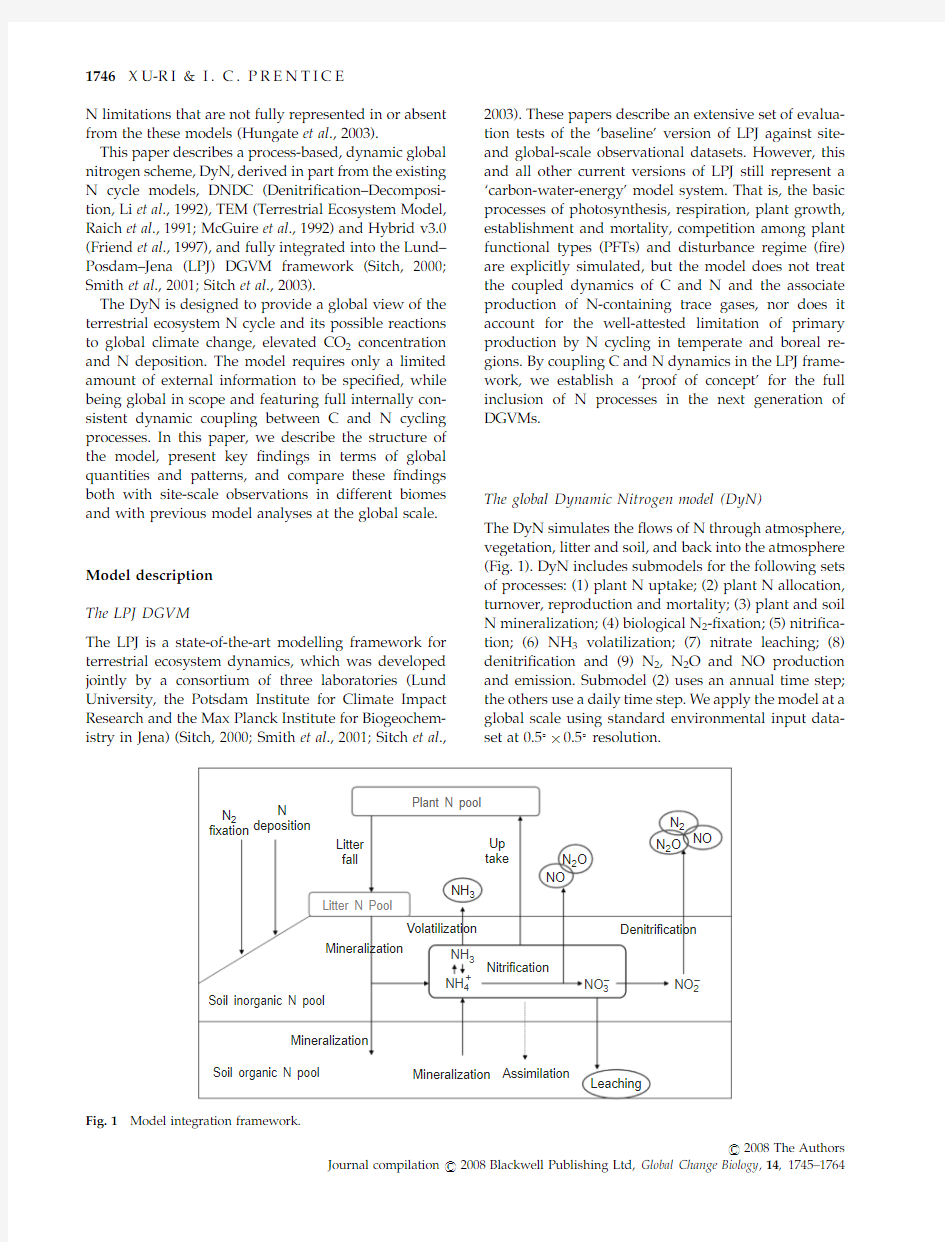
The global Dynamic Nitrogen model (DyN)
The DyN simulates the ?ows of N through atmosphere,vegetation,litter and soil,and back into the atmosphere (Fig.1).DyN includes submodels for the following sets of processes:(1)plant N uptake;(2)plant N allocation,turnover,reproduction and mortality;(3)plant and soil N mineralization;(4)biological N 2-?xation;(5)nitri?ca-tion;(6)NH 3volatilization;(7)nitrate leaching;(8)denitri?cation and (9)N 2,N 2O and NO production and emission.Submodel (2)uses an annual time step;the others use a daily time step.We apply the model at a global scale using standard environmental input data-set at 0.51?0.51resolution.
N 2
fixation NH 3
N 2O NH 3
NH 4
+NO 3
–NO 2
–
N 2
N 2O NO
NO
N deposition
Volatilization
Mineralization
Mineralization Assimilation
Leaching
Denitrification
Nitrification
Mineralization
Soil inorganic N pool
Soil organic N pool
Litter fall
Litter N Pool
Plant N pool
Up take
Fig.1Model integration framework.
1746X U-R I &I.C.P R E N T I C E
r 2008The Authors
Journal compilation r 2008Blackwell Publishing Ltd,Global Change Biology ,14,1745–1764
Plant N uptake.The uptake of mineral nitrogen(NO3àand NH41)by plants occurs each model day and is accumulated for allocation at the end of the year. Modelled N uptake depends on plant N uptake capacity and N availability in the soil[see Eqn(4), Table1].The N uptake capacity is determined by soil temperature(Bassirirad,2000;Dong et al.,2001)and plant N demand[Eqn(2),Table1].N demand is determined according to the amount of N that would be required for C production in the absence of N limitation(McGuire et al.,1992)[Eqn(1),Table1].N availability is a function of soil water content and the size of the inorganic nitrogen pool,including NO3àand NH41[Eqn(3),Table1].
When N uptake falls short of plant N demand,plant net primary production(NPP p)is decreased proportionally[Eqns(5)–(7),Table1].The N demand calculation depends on reference values of the C:N ratio(cton_pro,means C:N ratio for plant production when N is not limiting[Eqn(1)in Table1and Table4], which were applied directly from McGuire et al.(1992) and Melillo et al.(1993).
Litter N production:N turnover,N reproduction and mortality.These processes are simply modelled assuming conservative C:N ratios.A?xed10%of annual N uptake is deducted to account for the allocation to reproduction,and all the reproductive allocation is assumed to enter the aboveground litter pool[Eqn(1)in Table2].Each tissue is assigned a PFT-speci?c N turnover rate,identical to the C turnover rate as given by Sitch et al.(2003).N in each tissue is transferred either into the litter N pool(leaf and?ne root),or from living sapwood to heartwood[Eqn(2)in Table2].Mortality in LPJ may occur as a result of light competition,low growth ef?ciency,a negative annual
Table1Functions and parameters for plant N uptake
Eqn no.Function Equation
1Plant N demand N_demand5NPP p/cton_pro
2Plant N uptake capacity N_uptake_capacity5f temp?N_demand
3Soil N availability N_availability5W cont?N_pool
4Plant N uptake N_uptake5min(N_uptake_capacity,N_availability) 5N stress(0–1)N_stress5N_uptake/N_demand
6NPP with N stress NPP n5N_stress?NPP p
7Modeled NPP?nally NPP5min(NPP n,NPP p)
8Temperature limitation factor
for plant N uptake f temp5min{1,exp[308.56á(1/66.02à1/(T soil146.02))]} optimal temperature at201C
NPP,net primary production.
Table2Functions and parameters for litter N production
Eqn no.Function Equation
1N reproduction N repro5an_upáreprofraction
N inc5an_upàN repro
N litter,repro5N litter,repro,old1N repro
2N turnover D N
Litter;leaf ?
P
PFT
eN leaf f
leaf
PT
D N Litter;root?
P
PFT eN root f root PT
N leaf,new5N leaf,old(1àf leaf)
N root,new5N root,old(1àf root)
N sapwood,new5N sapwood,old(1àf sapwood)
N heartwood,new5N heartwood,old1N sapwood,old f sapwood
3Mortality N leaf,new5N leaf,old(1àmort)
N root,new5N root,old(1àmort)
N wood,new5N wood,old(1àmort)
N_litter,ag,new5N litter,ag,old1mortá(N leaf1N sapwood1N heartwood)
N litter,bg,new5N litter,bg,old1mortáN root
4Litter C:N CtoN_litter5(C litter,leaf1C litter,root1C litter,wood1C litter,repr)/
(N litter,leaf1N litter,root1N litter,wood1N litter,repr)
T E R R E S T R I A L N I T R O G E N C Y C L E S I M U L A T I O N1747
r2008The Authors
Journal compilation r2008Blackwell Publishing Ltd,Global Change Biology,14,1745–1764
carbon balance,heat stress,or when PFT bioclimatic limits are exceeded for an extended period(Sitch et al., 2003).N mortality rates were calculated as in the original LPJ model.N is transferred from the living biomass and heartwood of killed individuals to the above-and below-ground litter pools,with the same mortality rate as C[Eqn(3)in Table2].
Plant N allocation.Plant N allocation is calculated annually,after litter N production,in such a way as to maintain?xed relative C:N ratios among three compartments:sapwood plus heartwood,leaves and ?ne roots.Thus,the C:N ratio of any one tissue is allowed to vary as a function of nitrogen uptake and losses,while the relative ratios between tissues are conserved(Friend et al.,1997).
At the end of the year,after litter production and any heartwood formation,all the N in the plant,excluding the N bound into heartwood,is available for reallocation to the leaf,?ne root and sapwood compartments[Eqn(1),Table3].The partitioning coef?cients f_nl,f_nr and f_ns(fractions of total nitrogen allocated to leaf,?ne root and sapwood compartments,respectively)are de?ned in Eqn(2), Table3,where rcton_LS and rcton_LR are the relative C:N ratios between leaf and sapwood(C:N ratio for leaf/C:N ratio for sapwood)and between leaf and root (C:N ratio for leaf/C:N ratio for root).The values of these parameters(rcton_LS50.145and rcton_LR5 0.86)are from Friend et al.(1997).These two values are used for all PFTs,although in principle they could be PFT-speci?c.The new plant N compartment sizes are then given by Eqn(3),Table3.The C:N ratios for leaf, root and sapwood are recalculated after the allocation as in Eqn(4),Table3.During autotrophic respiration,the recalculated C:N ratio replaces the?xed C:N ratio used in the original LPJ[Eqn(22)in Sitch et al.,2003] [Eqn(5),Table3].
N?uxes from the atmosphere to the ecosystem.Although the atmosphere contains78%nitrogen as N2,most biological systems are N limited on physiological timescales because most biota are unable to use N2.N is transformed from N2into biologically available reactive N forms(NO y,NH x and organic N)by biological?xation and lightning,cycles among the biosphere,atmosphere,pedosphere and hydrosphere of the Earth and is?nally transformed back to N2by denitri?cation.
There are still large uncertainties in the reactive N sources from lightning and biological N2?xation(BNF). For lightning,while early estimates of the production ranged as high as4100Tg N yrà1(Liaw et al.,1990),the most recent estimates have settled within the range 1–20Tg N yrà1(Labrador et al.,2005).In the pristine biosphere,terrestrial ecosystems BNF are thought to have been an order of magnitude greater than?xation by lightning(Galloway et al.,1995).Estimates of BNF by terrestrial ecosystems range from40to200Tg N yrà1 (Schlesinger,1991).Recent estimates are$100–290 Tg N yrà1(Cleveland et al.,1999).
Although N2?xation from lightning and BNF are the primary sources for reactive nitrogen in terrestrial ecosystems under natural conditions,these processes are either under-represented or not represented in most ecosystem models.The Century ecosystem model (Schimel et al.,1996)for example calculates N2?xation as a linear function of actual evapotranspiration(AET), while most other models use even simpler approaches. This situation re?ects a rather weak understanding of
Table3Functions and parameters for plant N allocation
Eqn no.Function Equation
1N available for allocation at the end of year N alloc5N leaf1N root1N sapwood1N inc
2Partitioning coef?cients,f nl,f nr,f ns:fraction of
total N allocated to leaf,root and sapwood f_nl51/(11(rcton_LSáC sap1rcton_LRáC root)/C leaf) f_nr5rcton_LRáf_nláC root/C leaf
f_ns5rcton_LSáf_nláC sap/C leaf
3New N compartment sizes N leaf_new5f_nláN alloc
N root_new5f_nráN alloc
N sap_new5f_nsáN alloc
4New C:N ratios at the end of year CtoN_leaf_new5C leaf_new/N leaf_new
CtoN_root_new5C root_new/N root_new
CtoN_sapwood_new5C sap_new/N sap_new
5Update to C:N ratio during autotrophic
respiration(R leaf,R root and R sapwood)R leaf5ráC leaf/CtoN_leaf_newáfág(T)
R root5ráC root/CtoN_root_newáfág(T soil)
R sapwood5ráC sapwood/CtoN_sapwood_newág(T)
1748X U-R I&I.C.P R E N T I C E
r2008The Authors
Journal compilation r2008Blackwell Publishing Ltd,Global Change Biology,14,1745–1764
ecological controls of N2?xation,partly because accurate measurements of N2?xation in natural systems are dif?cult(Vitousek et al.,2002).
In the preindustrial world,a small amount of reactive N in the form of N trace gases(NO x and NH3)was emitted from ecosystems to the atmosphere in the processes of nitri?cation and denitri?cation and volatilization from vegetation/soils and biomass burning(Fig.1).A part of this reactive N was redistributed back to terrestrial ecosystems through the atmosphere by dry and wet deposition of NO y and NH x.The amount of reactive N,thus redistributed,has been estimated as4.5Tg N yrà1for NO y,and13Tg N yrà1for NH x(Galloway et al.,1995). In the absence of human activities,BNF was,thus the primary process converting N from a nonreactive to a reactive form.Most reactive N was ultimately emitted back to the atmosphere as N2such that the global rates of formation and loss of reactive N were approximately in balance.
In this study,we use a mass balance approach to simulate the natural N?uxes from atmosphere to the
plant–soil system without attempting to explicitly model either the controls of N2?xation or the recycling of reactive N through atmospheric transport. The underlying concept is that large N de?cits should occur when organic C is transferred from vegetation to soil.This follows from stoichiometry because of the high C:N in plants(30–430)as compared to soil organic matter(9–30)(Raich et al.,1991;McGuire et al., 1992,1995;Melillo et al.,1993).We assume that reactive N in the soil is derived both from mineralization processes and from natural N inputs from the atmosphere by the three processes listed above:BNF, lighting N2?xation and atmospheric transport.
The N?ux from the atmosphere to the soil–plant system is then modelled implicitly from the difference in C:N ratio between plant and soil based on two assumptions:(1)that the C:N ratio of soil organic matter is conservative;and(2)that when soil C is oxidized to CO2by heterotrophic respiration,the associated N is transformed to ammonium(NH41)(Li et al.,1992).The initial soil C:N ratios associated with different PFTs were taken from McGuire et al.(1992) (Table4).
Litter and soil N mineralization.The DyN represents a single litter N pool with a mineralization rate at101C of 0.35yearà1,and two soil N pools with mineralization rates at101C of0.03and0.001yearà1,corresponding to turnover times(t10)of2.86,33.3and1000year,res-pectively.N mineralization during litter and soil carbon decomposition is calculated from the appropriate(PFT speci?c)C:N ratio.The litter C:N ratio is calculated daily as a function of litter N production and N mineralization according to Eqn(4),Table2.Soil C:N ratios are as in Table4.
Ammonia volatilization.Ammonia(NH3)is the dominant gaseous base in the atmosphere,yet remains poorly characterized;the importance of natural emissions of NH3from soils and vegetation is still not well quanti?ed observationally(Langford et al.,1992; Dentener&Crutzen,1994;Potter et al.,2003). However,the essential processes involved in NH3 volatilization are known,and can be modelled.
NH3volatilization from soil is driven by the difference between the NH3partial pressure in equilibrium with the soil solution and that in the atmosphere.In the absence of other ionic species,the dissolved NH3concentration is controlled by NH41 concentration and pH(Freney et al.,1983).Calculation of NH3emissions is complicated by the spatial and temporal variability of the pH and NH41of the soil solution and the complexity transport processes (Milchunas et al.,1988).
Several process-based models have been developed to estimate NH3emissions from soil(e.g.Fleisher et al., 1987;Parton,1988a;Schimel et al.,1990).Most of these models require detailed knowledge of soil parameters that are extremely variable and typically unknown for natural ecosystems.Dawson(1977)and Langford et al. (1992)circumvented this limitation by relating soil parameters to more readily available climatic informa-tion and developed a model that predicts large-scale emissions from undisturbed soils.
Table4N-replete C:N ratios for plant production(cton_pro) and soil(cton_soil)(McGuire et al.,1992;Melillo et al.,1993) PFT cton_pro cton_soil Tropical Broad-leaved Evergreen
(TrBE)
43.7516.73
Tropical Broad-leaved Raingreen
(TrBR)
32.668.31
Temperate Needle-leaved
Evergreen(TeNE)
89.1723.86
Temperate Broad-leaved
Evergreen(TeBE)
90.6325.78 Temperate Broad-leaved
Summergreen(TeBS)
65.0020.09
Boreal Needle-leaved Evergreen
(BoNE)
52.3829.70 Boreal Needle-leaved
Summergreen(BoNS)
45.2418.15
Boreal Broad-leaved Summergreen
(BoBS)
Temperate Herbaceous(TeH)54.299.77 Tropical Herbaceous(TrH)69.5510.34
T E R R E S T R I A L N I T R O G E N C Y C L E S I M U L A T I O N1749
r2008The Authors
Journal compilation r2008Blackwell Publishing Ltd,Global Change Biology,14,1745–1764
The key innovation here,compared with the previous models of Dawson(1977),Langford et al. (1992)and Potter et al.(2003),relates to the sources of exchangeable NH41in the soil.The concentration of exchangeable NH41in the soil solution is?rst determined from the processes of nitri?cation,net N mineralization by the litter and soil,N2?xation and N assimilation into the plants.Dissolved NH41in the soil solution varies as a function of the NH41pool size,soil moisture content and soil temperature[Eqn(2),Table5]. The equilibrium partial pressure of NH3in the soil solution is then determined from NH41in the soil solution and soil pH[Eqn(3),Table5].When the soil solution pH exceeds6.0,NH3gas is formed by the deprotonation of NH41.The NH3/NH41ratio changes markedly with pH and is virtually zero(0.001)in solutions with pH6,but approaches unity(!0.90)in solutions with pH!10(Freney et al.,1983;Langford et al.,1992)[Eqn(6),Table5].Soil pH is determined from annual precipitation using the empirical relationship of Dawson(1977)[Eqn(5),Table5].The ?ux of NH3to the atmosphere is?nally estimated from the soil NH3concentration,soil moisture and soil temperature[Eqn(4),Table5].Table5summarizes the relationships used at each step.
Nitrate leaching.Of the various forms of nitrogen in soil, only NO3àcan be leached to deep layers,or out of the soil,in appreciable amounts.NO3àleaching,as a physical process of solute movement in soil,is proportional to soil nitrate concentration,soil properties and water?ux.NH41in the soil pro?les that is not taken up by plant is nitri?ed(forming NO3à).NO3ànot taken up by the plant is subject to denitri?cation,and since it is highly mobile in the soils, can also potentially be leached whenever there is runoff (Di&Cameron,2002;Van Drecht et al.,2003).In this model,the daily leaching?ux of NO3àout of the top 1.5m soil layer is determined by the soil NO3àpool,total available water holding capacity of the soil(TAWC)and daily runoff[see Eqns(2)and(3)in Table6].
Soil water is treated in two sublayers–the?rst (uppermost)0.5m,the second1.0m.TAWC of each sub-layer is de?ned as the difference between?eld capacity and wilting point(both soil texture-dependent).Soil texture also determines the in?ltration capacity of each sublayer.Runoff occurs when?eld capacity is exceeded in either sublayer(Haxeltine&Prentice, 1996).NO3àconcentrations in the soil are updated daily using the computed N leaching,nitri?cation, denitri?cation and the plant N assimilation?uxes. According to Eqns(2)and(3)in Table6,regions with high runoff,coarse soil texture and high NO3àavailability should have the highest leaching rates and shortest residence times of NO3àin the soil solution.In dry climates,annual water?ow through the soil is
Table5Functions and parameters for NH3volatilization
Eqn no.Function Equation
1Exchangeable NH41in the soil Determined from the processes of nitri?cation,net
mineralization,N2?xation and N assimilation into the
plants
2NH41in the soil solution NH41soil_solution5NH41soiláf tempáW cont
3NH3in the soil solution NH3soil_solution5NH41soil_solutionáf pH
4Daily?ux of NH3from soil to the atmosphere NH3gas5NH3soil_solutionáf tempá(1àW cont)
5Soil pH pH soil53810/(7621Precipitation annual)13.8
6Function in Eqn(3)f pH5exp(2á(pH soilà10))
7Function in Eqns(2)and(4)f temp5min{1,exp[308.56á(1/71.02à1/(T soil146.02))]}
Table6Functions and parameters for NO3àleaching
Eqn no.Function Equation
1NO3àconcentration in soil Determined by the processes of net N mineralization,
nitri?cation,denitri?cation,and N assimilation into the
plants
2Daily leaching?ux of NO3àfrom the1.5m soil layer NO3àleach5f leacháNO3àpool
3Function in Eqn2f leach51à(tawc/(tawc1runoff))
1750X U-R I&I.C.P R E N T I C E
r2008The Authors
Journal compilation r2008Blackwell Publishing Ltd,Global Change Biology,14,1745–1764
small,so the residence time of nitrate is longer than in humid climates.
There is a potential bias(underestimation)in the simulation of runoff in this version of LPJ as it does not take account of the effect of episodic precipitation events in the generation of runoff.Such a bias would in?uence the simulation of NO3àleaching as well. However,the comparison of simulated and observed zonal runoff in Sitch et al.(2003)suggests that the bias is not large in the annual average.
Nitri?cation and denitri?cation.Transformations among inorganic N species in soil take place through two main microbial pathways:nitri?cation and denitri?cation. Both of these are energy-yielding electron transfer pro-cesses regulated by the presence or absence of oxygen and the availability of appropriate N-containing substrates.Nitri?cation is an aerobic process in which NH41is oxidized to NO3àthrough the intermediate NO2à.The gaseous species NO and N2O are produced as intermediates and/or by-products.Denitri?cation is an anaerobic process in which oxidized forms of nitrogen(NO3à,NO2à,NO,N2O)are used as terminal electron acceptors during fermentation of organic substrates.The complete denitri?cation pathway results in the reduction of NO3àto N2,but signi?cant amounts of N2O and small amounts of NO may be emitted before complete reduction to N2(Tiedje et al., 1984;Firestone&Davidson,1989).
Factors that control nitri?cation and denitri?cation rates in soil include concentrations of the respective forms of mineral N(NH41and NO3à),soil water content, temperature,labile carbon availability(for denitri-?cation),and soil physical properties that in?uence gaseous diffusion rates.Models have been developed to estimate nitri?cation and denitri?cation in soils from ?eld to regional scales,including microbial growth models which simulate nitri?cation–denitri?cation by explicitly representing microbial dynamics(Li et al., 1992,2000;Li,2000),and simpli?ed models which represent N cycling processes as empirical functions of soil water,temperature and pH(Parton et al.,1996, 2001).
In this study,we have adopted an intermediate approach appropriate for global-scale analysis where-in many features of the nitri?cation and denitri?cation modules in DNDC(Li et al.,1992,2000)are used, especially the‘anaerobic balloon’concept as implemented in PnET-DNDC(Li et al.,2000)whereby nitri?cation and denitri?cation are allowed to occur simultaneously in aerobic and anaerobic microsites, respectively.Soil moisture(water-?lled pore space, WFPS)is used as an indicator to allocate sub-strates into two soil fractions with different aera-tion status.Nitri?cation and denitri?cation rates are then calculated directly from substrate availability (NH41for nitri?cation;labile C,NO3àand NO2àfor denitri?cation)and soil environmental factors(soil temperature and WFPS).The main differences between DyN and DNDC for the simulation of nitri?cation and denitri?cation are listed in Table7.
Table7The main differences between Dynamic Nitrogen(DyN)and DNDC(Li et al.,1992,2000;Li,2000)for the simulation of nitri?cation and denitri?cation
Items DNDC(Li et al.,1992,2000;Li,2000)DyN(this paper)
Explicit simulation of
microbial dynamics
Yes No
Soil aeration status used to allocate substrates Volumetric fraction of the anaerobic
microsites calculated based on soil
redox potential
Soil moisture as water-?lled pore space
(WFPS)
Denitri?cation Follows the reduction sequence
(NO3à!NO2à!NO!N2O!N2)Follows the reduction sequence (NO3à!NO2à!N2),NO and N2O simulated as by-products
Soil organic carbon
(SOC)needed as a
input parameter
Yes No
C:N for different plant
tissues and litter
Fixed,as input parameters Floating,calculated in the model*
Soil layer Multilayer(0–50cm)Single layer(0–50cm)
Minimum time step1h1day
*Plant C:N is a function of plant N uptake and N losses as litter fall;litter C:N is a function of litter N production and litter N losses as N mineralization.
T E R R E S T R I A L N I T R O G E N C Y C L E S I M U L A T I O N1751
r2008The Authors
Journal compilation r2008Blackwell Publishing Ltd,Global Change Biology,14,1745–1764
Nitri?cation.Soil moisture content(WFPS)of the top50cm layer is used to allocate substrates into the aerobic and anaerobic soil fractions.We assume that nitri?cation only occurs in aerobic microsites in the top 50cm.The potential rate of nitri?cation under aerobic conditions in the surface soil is mainly controlled by NH41availability(Khalil et al.,2004)and tempera-ture(Sierra,2002)[Eqn(1),Table8].N max in this equa-tion is the maximum fraction of NH41nitri?ed (N max50.1dayà1at201C,Khalil et al.,2004).According to Ingwersen et al.(1999),Breuer et al.(2002)and Sierra (2002),the nitri?cation rate is highly temperature-de-pendent,with an optimum at$381C and a Q10value of 4.0?0.2in the range between151C and251C.Eqn(2) in Table8describes this empirical relationship.
Although it is known that nitri?cation is a major source of NO and N2O from soil,the mechanism of production remains unclear.We therefore,simulate nitri?cation-induced NO and N2O production empiri-cally as fractions of predicted nitri?cation rates[Eqns (3)and(4)in Table8].Experimental results of Baum-ga¨rtner&Conrad(1992)and Parsons et al.(1996) showed that NO production makes up$0.1–4%of nitri?cation(R NON,the rate of NO production from nitri?cation).The fraction of N2O loss from gross nitri-?cation(R N2ON)is$0.1–0.2%according to the experi-mental results of Goodroad&Keeney(1984),Breuer et al.(2002)and Khalil et al.(2004),or0.01–0.05% according to Davidson et al.(1993)and Ingwersen et al.(1999).The values of R NON and R N2ON adopted in DyN are listed in Table11.
Denitri?cation.Denitri?cation is assumed to occur in anaerobic microsites within the top50cm soil layer, following the reduction sequence(NO3à!NO2à!N2).The rate of each process is controlled by the availability of the particular N oxide(NO3àor NO2à), labile C availability(Weier et al.,1993;Strong&Fillery, 2002;Murray et al.,2004)and soil temperature(Schipper et al.,1993;Maag et al.,1997;Maag&Vinther,1999) [Eqns(1)–(4),Table9].The rate of each process is assumed to respond to the relevant substrate concen-tration(NO3àor NO2à)following Michaelis–Menten kinetics(Strong&Fillery,2002).The maximum rate of denitri?cation,which occurs when the particular sub-strate concentration(NO3àor NO2à)is not limiting (DNmax),increases with soil available C,and likewise follows Michaelis–Menten kinetics(Strong&Fillery, 2002)[Eqns(2)–(4),Table9].In this study,the simulated heterotrophic CO2respiration within the soil was used as a surrogate for labile C availability(Parton et al., 2001).The Michaelis–Menten constants(half-saturation values)for labile C and N oxides were taken to be 0.017kg C mà3and0.083kg N mà3,from Li et al.(1992). The reaction rates of each process during the stepwise reduction of NO3àto N2increase with soil temperature with a Q10value of$2for the temperature range between15and251C(Schipper et al.,1993;Maag et al.,1997;Maag&Vinther,1999).
NO and N2O production from denitri?cation are simulated as fractions of the predicted denitri?cation rates during the transformation of NO2àinto N2,with a temperature response as in Eqn(1),Table9.The
Table8Functions and parameters for nitri?cation
Eqn no.Function Equation
1Nitri?cation rate NO3àinc5N maxáf tempáNH41soil,aerobic
2Temperature factor for nitri?cation ratio f temp5pow((70àT soil)/(70à38),12)áexp(12á(T soilà38)/(70à38)) 3NO from nitri?cation NO inc5R NONáNO3àinc
4N2O from nitri?cation N2O inc5R N2ONáNO3àinc
Table9Functions and parameters for denitri?cation
Eqn no.Function Equation
1Effect of soil temperature on denitri?cation f temp5exp[308.56á(1/68.02à1/(T soil146.02))]
2Effect of labile carbon availability(LCA)on denitri?cation DN max5LCA/(LCA1Kc)
3Denitri?cation ratio,NO3à!NO2àNO2àinc5DN maxáf tempáNO3àanaerobic/(NO3àanaerobic1Kn) 4Transformation of NO2àto N2N2inc5DN maxáf tempáNO2àanaerobic/(NO2àanaerobic1Kn) 5NO from denitri?cation NO inc5R NODNáf temp?N2inc
6N2O from denitri?cation N2O inc5R N2ODNáf temp?N2inc
7N2from denitri?cation N2inc,new5N2incàNO incàN2O inc
1752X U-R I&I.C.P R E N T I C E
r2008The Authors
Journal compilation r2008Blackwell Publishing Ltd,Global Change Biology,14,1745–1764
maximum rate of N 2O production from denitri?cation (R N2ODN )has been observed to be in the range of 0.2–4.7%with a mean of 2%in experiments by Groffman et al .(2000),Well et al .(2003)and Khalil et al .(2004).The NO production from denitri?cation is very slight.Ac-cording to the report of Murray &Knowles (2003),this fraction is o 0.2%[Eqns (5)and (6),in Table 9].The values of R NODN and R N2ODN adopted in DyN are listed in Table 11.
Diffusion of NO,N 2O and N 2from soil.When the
inorganic N species (NH 41
and NO 3à)are transformed
to NO,N 2O and N 2in the upper soil layers through nitri?cation and denitri?cation,these gases build up in the soil and are eventually released to the atmosphere.The main factors affecting NO,N 2O and N 2release are soil aeration status and temperature.A simple equation was adopted to quantify gas transport (Table 10).Fire disturbance.Fire is the most important natural disturbance to vegetation on a global scale,and is the only form of disturbance explicitly represented in LPJ.A full description of the standard LPJ ?re module is given by Thonicke et al .(2001).In DyN,when C in living biomass,heartwood and aboveground litter is converted to atmospheric CO 2by ?re,the associated N is released to the atmosphere as N 2,NO,N 2O and NH 3.
Data
For a global equilibrium run of the model,monthly mean temperature,precipitation and fractional sunshine hours were taken from the CLIMATE 1930–61average monthly climatology [an update of Leemans &Cramer (1991)]on a 0.51?0.51global grid,with a ?xed atmospheric CO 2concentration of 340ppm.Soil texture data were pre-scribed as in BIOME3(Haxeltine &Prentice,1996),based on the FAO soil dataset (Zobler,1986;FAO,1991).
The accuracy of N ?uxes computed at a relatively coarse space and time resolution is unknown a priori and,there-fore,we evaluate these modelled processes and ?uxes using various sets of observations and we compare our simulations of patterns and global quantities with pre-viously published calculations.The data we use to evaluate DyN at site scale for different biomes consist of 20so-called ‘calibration sites’from Raich et al .(1991)and McGuire et al .(1992)(the data include annual plant N uptake rate,plant N content,annual NPP and soil C content)supplemented with a further eight sites,with annual plant N uptake only ,compiled from literature (Table 12).We emphasize that these data are used here for model evaluation only;they are not used for calibration or tuning,although the ‘cali-bration sites’had earlier been used for this purpose during the development of the TEM model.
Table 11General model parameters in Dynamic Nitrogen (DyN)Symbol De?nition
Value Units Source
rcton_LR Relative C to N ratio between leaf and root
0.86–Friend et al .(1997)Rcton_LS Relative C to N ratio between leaf and sapwood
0.145–
Friend et al .(1997)N max Maximum fraction of NH 41
nitri?ed 0.1
day à1Khalil et al .(2004)R NON Rate of NO production from nitri?cation 0.1%–4%(mean:2%)day à1Baumga ¨rtner &Conrad (1992),Parsons et al .(1996)
R N2ON Rate of N 2O production from nitri?cation o 0.1à0.2%day à1Breuer et al .(2002),Khalil et al .(2004),Ingwersen et al .(1999)Kc Michaelis–Menten constant for labile carbon 0.017kg C m à3Li et al .(1992)Kn
Michaelis–Menten constant for N oxides 0.083
kg N m à3Li et al .(1992)
R N2ODN Rate of N 2O production from denitri?cation 0.2%à4.7%(mean:2%)day à1Groffman et al .(2000),Well et al .(2003),Khalil et al .(2004)
R NODN
Rate of NO production from denitri?cation
o 0.2%
day à1
Murray &Knowles (2003)
Table 10
Functions and parameters for the diffusion of N gases
Eqn no.Function Equation
1Effect of soil temperature on gas diffusion f temp 5min{1,exp[308.56(1/71.02à1/(T soil 146.02))]}2
Daily N gas (N 2,NO,N 2O)released from soil to the atmosphere NO inc 5NO soil áf temp á(1àW cont )
N 2O inc 5N 2O soil áf temp á(1àW cont )N 2inc 5N 2soil áf temp á(1àW cont )
T E R R E S T R I A L N I T R O G E N C Y C L E S I M U L A T I O N
1753
r 2008The Authors
Journal compilation r 2008Blackwell Publishing Ltd,Global Change Biology ,14,1745–1764
Results and discussion
Equilibrium simulations
The external driving variables required by DyN are limited to climate(monthly values of temperature, precipitation and fractional sunshine hours),ambient CO2concentration(global value),and soil texture class (Sitch et al.,2003).All parameter values applied in this study,as derived from literature sources,are listed in Table4and Table11.No re-parameterization or‘tuning’was performed,either for general or for PFT-speci?c parameters Simulations were started from‘bare ground’(no plant biomass present)and‘spun up’for 2000model years,allowing approximate equilibrium with respect to the C and N pools.We present results for ?uxes(such as NPP and annual N uptake)as values for the last simulation year,and for all state variables as values at the end of the last simulation day.
Fifteen sites[marked with asterisk(*)in Table12]were selected to illustrate the global range of biomes.Fig.2shows the dynamics of vegetation N and Fig.3shows the dynamics of soil organic and inorganic N in each biome during2000model years.Note,at equilibrium,N inputs to each pool must be balanced by outputs,such that
dN plant
d t
?N uptakeàN litterfall
dN litter
d t
?N litterfallàN litter mineralized total
dN soil organic
d t
?N inputtN litter mineralized parte1T
àN soil net mineralized
dN soil inorganic
d t
?N inputtN litter mineralized parte2T
tN soil net mineralizedàN uptakeàN lost
N input?N natural fixationtN deposition
N lost?N2O fluxestNO fluxestNH3fluxestN2fluxestN leach N litter mineralized total?N litter mineralized parte1T
tN litter mineralized parte2T:
Table12Sites used for model evaluation
No.Longitude Latitude Vegetation type Location Source
1*à672Tropical broadleaved evergreen Venezuela Raich et al.(1991)
2102.53Tropical broadleaved evergreen Malaysia Raich et al.(1991)
3à60à3Tropical broadleaved evergreen Brazil Raich et al.(1991)
4*à16Tropical moist semi-deciduous Kade,Ghana Raich et al.(1991)
5à4 5.5Tropical broadleaved evergreen Ivory coast Raich et al.(1991)
6*à6618Tropical broadleaved evergreen Puerto Rico Raich et al.(1991)
7à6718Tropical dry forest Puerto Rico Raich et al.(1991)
8*28.5à24.5Tropical Savanna South Africa Raich et al.(1991)
98325.5Tropical dry deciduous Chakia,India Raich et al.(1991)
10*175à41Temperate broadleaved evergreen New Zealand Raich et al.(1991)
11*à7242.5Temperate deciduous Massachusetts,USA McGuire et al.(1992)
12*à9345.5Temperate Savanna USA McGuire et al.(1992)
13*à96.537Tall grass prairie Oklahoma,USA Raich et al.(1991)
14*à10541Short grassland Colorado,USA McGuire et al.(1992)
15*à11341Arid Shrub land Utach,USA McGuire et al.(1992)
16*à68à34Arid Shrub land Argentina Raich et al.(1991)
17*à122.544Temperate conifer forest Oregen,USA McGuire et al.(1992)
18*à148.564.5Boreal forest Alaska McGuire et al.(1992)
19*à66.554.5Boreal woodland Quebec,Canada McGuire et al.(1992)
20*à145.565.5Tundra Alaska McGuire et al.(1992)
21à122.037.5Tall grassland California,USA Hungate et al.(1997)
22à105.540Dry meadows Colorado,USA Fisk et al.(1998)
23 6.552Temperate deciduous The Netherlands Tietema&Verstraten(1991)
24à89.543Temperate deciduous Wisconsin,USA Nadelhoffer et al.(1983)
25à7242.5Temperate deciduous Harvard Forest USA Scott&Binkley(1997)
26951Temperate conifer Solling,Germany Roubuch&Joergensen(2002)
27à7441Temperate deciduous New York,USA Zhu&Carreiro(2004)
281648Temperate deciduous Vienna,Austria Zechmeister-Boltenstern et al.(2002) *Denotes the15sites selected to represent global biomes,and to show the detailed comparisons between observations and model results(Figs7and8).
1754X U-R I&I.C.P R E N T I C E
r2008The Authors
Journal compilation r2008Blackwell Publishing Ltd,Global Change Biology,14,1745–1764
Site scale evaluation
Simulated annual N uptake is compared to site-scale observations in Fig.4.Simulated and observed annual N uptake are highly correlated (Table 12)with r 50.95,n 528,P o 0.001.The 20sites with plant N content observations reported by Raich et al .(1991)and McGuire et al .(1992)(Table 12)were used to evaluate
simulated N content in living biomass;simulated plant N contents also compare well with observations (Table 12)with r 50.83,n 520,P o 0.001(Fig.5).
Simulated NPP is well correlated with observed NPP ,whether or not the N cycle is included.The correlation coef?cients (r )are 0.94(n 520,P o 0.001)for LPJ and 0.92(n 520,P o 0.001)for LPJ–DyN.However,LPJ without the N cycle shows a systematic bias,such that
0.180.160.140.12P l a n t N (k g N m –2)
L i t t e r N (k g N m –2)
0.080.060.040.02
TrBE TeBE TeBS TaGr TeNE Tundra
BoNE BoS ShGr ArSh ArSh TrBR TrBR-d TrBR-s TeBS-s TrBE TeBE 2000 modelling years for each site
TeBS TaGr TeNE Tundra
BoNE BoS ShGr ArSh ArSh TrBR TrBR-d TrBR-s TeBS-s 0
0.06
0.080.1
0.041
2
3
4
56
7
8
910
11
12
13
1415
0.020
0.1Fig.2Simulated plant N and litter N content,shown approaching equilibrium values during 2000model years.Results shown are for the 15sites labeled with an asterisk (*)in Table 12.
1.51.20.90.60.3
S o i l o r g a n i c N (k g N m –2)
S o i l i n o r g a n i c N (k g N m –2)
TrBE TeBE TeBS TaGr TeNE Tundra
BoNE BoS ShGr ArSh
ArSh TrBR TrBR-d TrBR-s TeBS-s TrBE TeBE 2000 modelling years for each site
TeBS TaGr TeNE Tundra
BoNE BoS ShGr ArSh ArSh TrBR TrBR-d TrBR-s TeBS-s 0
0.0090.0120.015NH 4NO 3
0.0061
2
3
4
5
6
7
8
9
10
11
12
13
1415
0.003
–+
Fig.3Simulated soil organic and inorganic N contents,shown approaching equilibrium values during 2000model years.Selection of sites as Fig.2.
T E R R E S T R I A L N I T R O G E N C Y C L E S I M U L A T I O N
1755
r 2008The Authors
Journal compilation r 2008Blackwell Publishing Ltd,Global Change Biology ,14,1745–1764
the best-?t line in Fig.6for LPJ-simulated values vs.observed values lies above the 1:1line in the lower NPP range.Inclusion of the N cycle through DyN eliminates this bias and thereby produces smaller,more realistic modelled NPP and soil organic C values in temperate forests (sites 10,11and12),boreal forests (sites 18and 19)and tundra (site 20)(Fig.7).This improvement occurs because low soil temperature in these regions restricts the plant N uptake capacity,as described in ‘Plant N uptake’.
Global scale applications
Annual N uptake.Equilibrium global annual N uptake by vegetation is simulated to be 1.084Pg N yr à1or 8.14g N m à2yr à1(Fig.8).The simulated global amount and pattern of annual N uptake are in good agreement with a previous simulation by Melillo et al .(1993; 1.073Pg N yr à1).As shown in Fig.8,tropical
biomes (tropical rainforest,seasonal forest and dry forest/savanna)contribute the largest fraction of the global simulated vegetation N uptake.Simulated annual N uptake in these ecosystems ranges from 12to 36g N m à2yr à1.Temperate forest biomes have lower rates of simulated N uptake,ranging between 6and 12g N m à2yr à1.Temperate grasslands,boreal forests,tundra and desert have the lowest simulated annual N uptake,o 6g N m à2yr à1(Fig.8).
Plant N content.Global total vegetation nitrogen content is simulated to be 5.3Pg N,lower than previous model estimates which have ranged from 10to16Pg N (Lin et al .,2000).Tropical rainforest and tropical seasonal forests have the most simulated vegetation N (90–220g N m à2),followed by temperate forests (40–90g N m à2),boreal forest,tundra and desert,with o 40g N m à2(Fig.9).
05101520253035
Observed N uptake (g N m –2 yr –1)
S i m u l
a t e d N u p t a k e (g N m –2 y r –
1)
Fig.4Simulated vs.observed annual N uptake (n 528).
Fig.5Simulated vs.observed plant N content (n 520).Solid line is the
1:1line;the dashed line is regression.
Fig.6Simulated vs.observed annual net primary production,n 520,with Lund–Posdam–Jena (LPJ)-Dynamic Nitrogen (DyN)and without (LPJ)coupled N cycle,Solid line is the 1:1line;the dashed lines are regressions.
Fig.7Simulated vs.observed soil C pools,indicating those biomes where Lund–Posdam–Jena (LPJ)-Dynamic Nitrogen (DyN)is closer to observations than LPJ without a N cycle.Selection of sites as Fig.2.
1756X U-R I &I.C.P R E N T I C E
r 2008The Authors
Journal compilation r 2008Blackwell Publishing Ltd,Global Change Biology ,14,1745–1764
Litter N content.Global total litter N content is simulated to be 4.6Pg N.Litter N,thus may represent a substantial fraction of the terrestrial budget,but there have been few published estimates of the size of this pool.The boreal forests and the tropical moist forests contain the most simulated litter N,ranging from 36to 90g N m à2,followed by tropical dry forests/savanna and temperate moist forests,ranging from 18to 36g N m à2(Fig.10).Temperate grasslands,arid shrublands,tropical/temperate deserts and polar deserts have the lowest simulated litter N content,o 18g N m à2(Fig.10).Soil N content.Simulated global soil organic N storage (Fig.11)shows a similar distribution pattern to soil C storage,consistent with the distribution pattern derived from ?eld observations as summarized by Post et al .(1985).Simulated soil N storage ranges from o 0.2kg N m à2in warm desert regions to 1.8kg N m à2in boreal woodland and tundra,0.8–1.8kg N m à2in warm rain forests,boreal woodland and tundra (red,Fig.11),0.3–0.8kg N m à2in warm dry forest,temperate moist forests,and steppe/grassland (green and yellow,Fig.11)and o 0.3kg N m à2in warm and temperate deserts (blue,Fig.11).The global total organic N storage in surface soil (top 1.5m)was simulated to be 56.8Pg N [i.e.only about 60%of the 95Pg N estimated by Post et al .(1985)].There are two possible reasons for this difference.First,total soil organic N storage is dominated by the slowest N pool,which was still
some way from equilibrium in boreal forest and tundra regions even after 2000years of spin-up.Simulated total soil organic N rose to 67Pg (i.e.about 70%of the Post et al .value in a 5000years spin-up).Second,soil organic C :N ratio for different PFTs in this model were assumed to be conservative.The model-estimated global soil total C :N ratio was 16.7,whereas Post et al .(1985)estimated 13.3.However,available data do not allow us to determine which of these two estimates of the global soil C :N ratio is more accurate.
Soil inorganic N content (NH 41
,NO 3à).Organic nitrogen is
globally the largest pool of N in the terrestrial biosphere,contributing up to 90%of total soil N.The
mineral N pools (mainly NH 41
and NO 3à)are small,but
they are critical intermediaries in the global N cycle.Under natural conditions,most reduced N would exist
in the form of NH 4
1
.In the atmosphere,NH 3combines with H 1
in water or reacts with acids to produce NH 41that is readily deposited on vegetation and soil surfaces.
In soil,NH 4
1
is the initial product of both N ?xation and soil mineralization.NH 4
1
can be taken up by plants,utilized for microbial growth,or oxidized to NO 3àby
nitri?cation.NO 3à
can be taken up by plants and micro-organisms,and can be reduced to N 2O and N 2by
denitri?cation.Unlike NH 41
,NO 3àis easily leached
from the soil.
The global natural distribution patterns of the two main inorganic N pools are modelled here for the
?rst
Fig.8Simulated global distribution of annual N uptake (kg N m à2yr à1).
T E R R E S T R I A L N I T R O G E N C Y C L E S I M U L A T I O N 1757
r 2008The Authors
Journal compilation r 2008Blackwell Publishing Ltd,Global Change Biology ,14,1745–1764
time.Global soil NH 41
for the full 1.5m soil (Fig.12)is simulated as 361Tg N with a range from 0in deserts to 0.02kg N m à2in boreal woodland and tundra.High-latitude (4451)boreal woodlands and tundra have the highest simulated soil NH 4
1
inventory (0.008–0.02kg N m à2
),followed by boreal needle-leaved evergreen forest (0.004–0.008kg N m à2).Much of the
world is simulated to have low NH 4
1
inventories Fig.9Simulated global distribution of plant N content (kg N m à2
).
Fig.10Simulated global distribution of litter N content (kg N m à2).
1758X U-R I &I.C.P R E N T I C E
r 2008The Authors
Journal compilation r 2008Blackwell Publishing Ltd,Global Change Biology ,14,1745–1764
(o 0.004kg N m à2):temperate forests and grasslands with 0.002–0.004kg N m à2,tropical forests 0.001–0.0025kg N m à2and arid shrub lands and deserts o 0.001kg N m à2.Global soil NO 3àfor the top 1.5m soil layer is simulated as 580Tg N,ranging from 0to 0.262kg N m à2(Fig.13).The global distribution pattern of simulated NO 3àis complementary to that of
NH 41
.Tropical and temperate desert regions have a much higher simulated NO 3àinventory than the rest of the world (0.004–0.02kg N m à2).In the tropical and subtropical deserts,simulated soil NO 3àreaches values
40.02kg N m à2
.Values as high as 0.262kg N m à2are simulated in the Sahara (Fig.13).Nondesert regions by
contrast show low NO 3àinventories,o 0.004kg N m à2
.Tropical and moist temperate forests have the lowest
simulated least NO 3àinventories,o 0.001kg N m à2
.If these model results are realistic,they imply that global deserts could be an important NO 3àreservoir,especially tropical and subtropical deserts where simulated NO 3àinventories are in the range 0.004–
0.262kg N m à2
with a mean value of 0.02kg N m à2(200kg N ha à1).Under dry conditions in the model,nitri?cation is much more rapid than denitri?cation and low rainfall implies low leaching rates which enable NO 3àto build up in the soil.This model result is consistent with Walvoord et al .(2003)who reported a large nitrate pool of 0.003–1.36kg N m à2(or 30–13600kg N ha à1)located deep (41m)beneath
temperate deserts in the western USA.In our global
simulation,the total NO 3
àinventory in deserts (representing only the top 1.5m of regolith)is about 460Tg N,contributing $80%of the global total NO 3àinventory.
Soil inorganic to organic N ratio.Global soil inorganic N (0.94Pg N,2000spin-up years)is simulated to be only 1.66%of global organic N (56.8Pg N)in simulations that were spun up for 2000years.However,both organic N and inorganic N have very high simulated spatial variability.In tropical/subtropical forest and tempe-rate moist forest regions,the modelled soil inorganic to organic N ratio is less than 1%(Fig.14).In warm and temperate deserts,the proportion of N in inorganic forms becomes much greater,ranging from 5%to 100%.In some hyperarid regions,the simulated ratio greatly exceeds 100%.
In moist regions,organic N is estimated to be the dominant form of stored N in soil,with inorganic N contributing o 5%of total N.In arid regions,by contrast,N in the soil mainly exists as inorganic N,principally NO 3à.
Concluding remarks
The main differences between DyN and previous global terrestrial N cycle models are listed in Table 13.The central point is that DyN includes a full
interaction
Fig.11Simulated global distribution of soil organic N content (kg N m à2).
T E R R E S T R I A L N I T R O G E N C Y C L E S I M U L A T I O N 1759
r 2008The Authors
Journal compilation r 2008Blackwell Publishing Ltd,Global Change Biology ,14,1745–1764
Fig.12Simulated global distribution of soil inorganic N content (kg N m à2)as NH 41
.
Fig.13Simulated global distribution of soil inorganic N content (kg N m à2)as NO 3à.
1760X U-R I &I.C.P R E N T I C E
r 2008The Authors
Journal compilation r 2008Blackwell Publishing Ltd,Global Change Biology ,14,1745–1764
among the C,N and water cycles,and a complete coupling between these biogeochemical cycles and ve-getation dynamics.Thus,we have been able to simulate major features of site-and global-scale N cycling with no external information provided other than climate and soils data,prescribed atmospheric CO 2concentra-tion,and a set of (nontuned)parameter values describ-ing ecosystem processes and the morphological,physiological and biogeochemical characteristics of a small set of PFTs.In doing so,we have achieved a plausible simulation of global amounts and patterns of different N stores and ?uxes,while measurably improv-ing the modelling of C ?uxes and storages through representation of the feedback from N cycling to plant productivity.
As in all applications of DGVMs,we have necessarily adopted simpli?ed,partly empirical treatments of pro-cesses that operate at ?ner spatial and temporal
scales
Fig.14Simulated global distribution of the inorganic to organic N ratio (%).
Table 13Comparison of Dynamic Nitrogen (DyN)with previous reported terrestrial N cycle models
Processes and functions TEM DNDC
Hybrid 3.0
Century
CASA
N cycle DyN Reference
Raich et al .(1991),MacGuire et al .(1992)Li et al .(1992,2000)Friend et al .(1997)Parton et al .(1988b),Schimel et al .(1996)Potter et al .(1993,1996)
Lin et al .(2000)
This study
Plant N uptake Yes Yes Yes Yes No Yes Yes Plant N allocation No No Yes No No No Yes N turn over,
reproduction,mortality No No Yes No No No Yes C/N of plant tissues
Fixed Fixed Floating Fixed Fixed Fixed Floating Nitri?cation/denitri?cation No Yes No Yes *No Yes Yes N 2O/NO/NH 3production No Yes No Yes Yes No Yes Global scale inorganic N balance and distribution
No
No
No
No
No
No
Yes
*In the DayCent version (Parton et al .,1996,2001),nitri?cation and denitri?cation processes have been included in the Century
model for the site scale.
T E R R E S T R I A L N I T R O G E N C Y C L E S I M U L A T I O N 1761
r 2008The Authors
Journal compilation r 2008Blackwell Publishing Ltd,Global Change Biology ,14,1745–1764
than is practical to consider explicitly in a global ana-lysis.We have also adopted a simple approach to modelling N uptake and the in?uence of N constraints on NPP which captures the basic phenomenon of N limitation and allows a degree of plasticity in plant N use,but we have not yet attempted a full process simulation of photosynthesis and plant allocation re-sponses to N constraints.The effects of these various simpli?cations could not be predicted in advance,thus the model’s demonstrated ability to approximate ob-served values of N storages and?uxes provides neces-sary support for our modelling approach.We have also succeeded in ful?lling a key expectation for the inclu-sion of N cycling in a DGVM,namely the simulation of smaller and more realistic values of NPP and soil carbon storage(relative to the standard LPJ version) due to N limitation in cold-climate ecosystems.
The focus of this work has so far been limited to the ‘baseline’condition of the terrestrial biosphere.We have not considered,for example,the consequences of fossil fuel burning,fertilizer use and agricultural manage-ment practices which have hugely modi?ed the pro-cesses and amounts of terrestrial N cycling in the modern world.Trace gas(N2O,NO and NH3)emissions from natural ecosystems also remain to be quantita-tively evaluated against observations.In a forthcoming manuscript,we plan to further evaluate DyN from the view of C and N interactions and to use the model to quantify the potential consequences of increasing anthropogenic N deposition for terrestrial ecosystem C uptake.
Acknowledgements
Special thanks are due to Prof.Chang-Sheng Li,Prof.Guy Brasseur,Dr Wolfgang Knorr,Dr Jens Kattge and Dr Hai-Shan Niu for their interest in the project and constructive suggestions during model development.Thanks are also due to Heiner Widmann,Caroline Narayan,Ingrid Engvall,Thomas Raddatz, Luca Criscuolo and Christian Reick for technical advice and support.This research was funded by the Max-Planck Society, the Max-Planck Institute for Biogeochemistry,the Max-Planck Institute for Meteorology and the National Natural Science Foundation of China(40605032).
References
Bassirirad H(2000)Kinetics of nutrient uptake by roots:re-sponses to global change.New Phytologist,147,155–169. Baumga¨rtner M,Conrad R(1992)Effects of soil variables and season on the production and consumption on nitric oxide in oxic soils.Biology and Fertility of Soils,14,166–174.
Breuer L,Kiese R,Butterbach-Bahl K(2002)Temperature and moisture effects on nitri?cation rates in tropical rain-forest soils.Soil Science Society of America Journal,66,834–844.Cleveland CC,Townsend AR,Schimel DS et al.(1999)Global patterns of terrestrial biological nitrogen(N2)?xation in natural ecosystems.Global Biogeochemical Cycles,13,623–645. Cramer W,Bondeau A,Woodward FI et al.(2001)Global re-sponses of terrestrial ecosystems to changes in CO2and climate.Global Change Biology,7,357–373.
Davidson EA,Matson PA,Vitousek PM,Riley R,Dunkin K, Garcia-Mendez G,Maass JM(1993)Process regulation of soil emissions of NO and N2O in a seasonally dry tropical forest. Ecology,74,130–139.
Dawson GA(1977)Atmospheric ammonia from undisturbed land.Journal of Geophysical Research,82,3125–3133. Dentener FJ,Crutzen PJ(1994)A three-dimensional model of the global ammonia cycle.Journal of Atmospheric Chemistry,19, 331–369.
Di HJ,Cameron KC(2002)Nitrate leaching in temperate agroe-cosystems:sources,factors and mitigating strategies.Nutrient Cycling in Agroecosystems,46,237–256.
Dong S,Scagel CF,Cheng L,Fuchigami LH,Rygiewicz PT(2001) Soil temperature and plant growth stage in?uence nitrogen uptake and amino acid concentration of apple during early spring growth.Tree Physiology,21,541–547.
FAO(1991)The digitized soil map of the world(Release1.0).Vol.67/ 1,Food and Agriculture Organization of the United Nations. Firestone MK,Davidson EA(1989)Microbiological basis of NO and N2O production and consumption in soil.In:Exchange of Trace Gases Between Terrestrial Ecosystems and the Atmosphere, Dahlem Workshop Rep.47(eds Andreae MO,Schimel DS),pp. 7–21.John Wiley,New York.
Fisk MC,Schmidt SK,Seastedt TR(1998)Topographic patterns of above and belowground production and nitrogen cycling in alpine tundra.Ecology,79,2253–2266.
Fleisher Z,Kenig A,Ravina I,Hagin J(1987)Model of ammonia volatilization from calcareous soils.Plant and Soil,103,205–212. Freney JR,Simpson JR,Denmead OT(1983)V olatilization of ammo-nia.In:Gaseous Losses of Nitrogen From Plant–Soil Systems(eds Freney JR,Simpson JR),pp.1–32.Martinus Nijhoff/Dr. W.Junk Publishers,Hague,the Netherlands.
Friend AD,Stevens AK,Knox RG,Cannell MGR(1997)A process-based,terrestrial biosphere model of ecosystem dy-namics(Hybrid3.0).Ecological Modelling,95,249–287. Galloway JN,Schlesinger WH,Levy IIH,Michaels A,Schnoor JL (1995)Nitrogen?xation:anthropogenic enhancement-envir-onmental response.Global Biogeochemical Cycles,9,235–252. Goodroad LL,Keeney DR(1984)Nitrous oxide emission from forest,marsh,and prairie ecosystems.Journal of Environmental Quality,13,448–452.
Groffman PM,Gold AJ,Addy K(2000)Nitrous oxide production in riparian zones and its importance to national emission inventories.Chemosphere–Global Change Science,2,291–299. Haxeltine A,Prentice IC(1996)BIOME3:an equilibrium terres-trial biosphere model based on ecophysiological constraints, resource availability,and competition among plant functional types.Global Biogeochemical Cycles,10,693–709.
Holland EA,Braswell BH,Lamarque JF et al.(1997)Variations in the predicted spatial distribution of atmospheric nitrogen deposition and their impact on carbon uptake by terrestrial ecosystems.Journal of Geophysical Research,102,15849–15866.
1762X U-R I&I.C.P R E N T I C E
r2008The Authors
Journal compilation r2008Blackwell Publishing Ltd,Global Change Biology,14,1745–1764
Houghton RA(2003)Why are estimates of the terrestrial carbon balance so different?Global Change Biology,9,500–509. Houghton RA,Davidson EA,Woodwell GM(1998)Missing sinks,feedbacks,and understanding the role of terrestrial ecosystems in the global carbon balance.Global Biogeochemical Cycles,12,25–34.
House JI,Prentice IC,Ramankutty N,Houghton RA,Heimann M(2003)Reconciling apparent inconsistencies in estimates of terrestrial CO2sources and sinks.Tellus,55B,345–363. Hungate BA,Chapin FS,Zhong H,Holland EA,Field CB(1997) Stimulation of grassland nitrogen cycling under carbon diox-ide enrichment.Oecologia,109,149–153.
Hungate BA,Dukes JS,Shaw MR,Luo Y,Field CB(2003) Nitrogen and climate change.Science,302,1512–1513. Ingwersen J,Butterbach-Bahl K,Gasche R,Richter O,Papen H (1999)Barometric process separation:new method for quanti-fying nitri?cation,denitri?cation,and nitrous oxide sources in soils.Soil Science Society of America Journal,63,117–128. Khalil K,Mary B,Renault P(2004)Nitrous oxide production by nitri?cation and denitri?cation in soil aggregates as affected by O2concentration.Soil Biology&Biochemistry,36,687–699. Labrador LJ,von Kuhlmann R,Lawrence MG(2005)The effects of lightning-produced NOx and its vertical distribution on atmospheric chemistry:sensitivity simulations with MATCH-MPIC.Atmospheric Chemistry and Physics,5, 1815–1834.
Langford AO,Fehsenfeld FC,Zachariassen J,Schimel DS(1992) Gaseous ammonia?uxes and background concentrations in terrestrial ecosystems of the United States.Global Biogeochem-ical Cycles,6,459–483.
Leemans R,Cramer W(1991)The IIASA database for mean monthly value of temperature,precipitation and cloudiness of a global terrestrial grid,International Institute for Applied Systems Analysis(IIASA),RR-91-18.
Li CS(2000)Modeling trace gas emissions from agricultural ecosystems.Nutrient Cycling in Agroecosystems,58,259–276. Li CS,Aber J,Stange F,Butterbach-Bahl K,Papen H(2000)A process-oriented model of N2O and NO emissions from forest soils:1.Model development.Journal of Geophysical Research, 105,4369–4384.
Li CS,Frolking S,Frolking TA(1992)A model of nitrous oxide evolution from soil driven by rainfall events:1.Model structure and sensitivity.Journal of Geophysical Research,97,9759–9776. Liaw YP,Sisterson DL,Miller NL(1990)Comparison of?eld, laboratory,and theoretical estimates of global nitrogen ?xation.Journal of Geophysical Research,95,22489–22494.
Lin BL,Sakoda A,Shibasaki R,Goto N,Suzuki M(2000) Modelling a global biogeochemical nitrogen cycle in terrestrial ecosystems.Ecological Modelling,135,89–110.
Maag M,Malinovsky M,Nielsen SM(1997)Kinetics and tem-perature dependence of potential denitri?cation in riparian soils.Journal of Environmental Quality,26,215–223.
Maag M,Vinther FP(1999)Effect of temperature and water on gaseous emissions from soils treated with animal slurry.Soil Science Society of America Journal,63,858–865.
McGuire AD,Melillo JM,Joyce LA,Kicklighter DW,Grace AL, Moore B III,Vorosmarty CJ(1992)Interactions between carbon and nitrogen dynamics in estimating net primary productivity
for potential vegetation in north America.Global Biogeochemical Cycles,6,101–124.
McGuire AD,Melillo JM,Kicklighter DW,Joyce LA(1995)Equili-brium responses of soil carbon to climate change:empirical and process-based estimates.Journal of Biogeography,22,785–796. Melillo JM,McGuire AD,Kicklighter DW,Moore B III,Voros-marty CJ,Schloss AL(1993)Global climate change and terres-trial net primary production.Nature,363,234–240. Milchunas DG,Parton WJ,Bigelow DS,Schimel DS(1988)Factors in?uencing ammonia volatilization from urea in soils of the shortgrass steppe.Journal of Atmospheric Chemistry,6,323–340. Murray PJ,Hatch DJ,Dixon ER,Stevens RJ,Laughlin RJ,Javis SC (2004)Denitri?cation potential in grassland subsoil:effect of carbon substrates.Soil Biology&Biochemistry,36,545–547. Murray RE,Knowles R(2003)Production of NO and N2O in the presence and absence of C2H2by soil slurries and batch cultures of denitrifying bacteria.Soil Biology&Biochemistry, 35,1115–1122.
Nadelhoffer KJ,Aber JD,Melillo JM(1983)Leaf litter production and soil organic matter dynamics along a nitrogen-availability gradient in Southern Wisconsin(USA).Canadian Journal of Forest Research,13,12–21.
Parsons DAB,Scholes MC,Scholes RJ,Levine JS(1996)Biogenic NO emissions from savanna soils as a function of?re regime, soil type,soil nitrogen,and water status.Journal of Geophysical Research,101,23683–23688.
Parton WJ,Holland EA,Del Grosso SJ et al.(2001)Generalized model for NO x and N2O emissions from soils.Journal of Geophysical Research,106,17403–17419.
Parton WJ,Morgan JA,Altenhofen JM,Harper LA(1988a) Ammonia volatilization from spring wheat plants.Agronomy Journal,80,419–425.
Parton WJ,Mosier AR,Ojima DS,Valentine DW,Schimel DS, Weier K,Kulmala AE(1996)Generalized model for N2and N2O production from nitri?cation and denitri?cation.Global Biogeochemical Cycles,10,401–412.
Parton WJ,Stewart JWB,Cole CV(1988b)Dynamics of C,N,P and S in grassland soils:a model.Biogeochemistry,5,109–131. Post WM,Pastor J,Zinke PJ,Stangenberger AG(1985)Global patterns of soil nitrogen storage.Nature,317,613–616. Potter C,Klooster S,Krauter C(2003)Regional modeling of ammonia emissions from native soil sources in California. Earth Interactions,7,1–28.
Potter CS,Matson PA,Vitousek PM,Davidson EA(1996)Process modeling of controls on nitrogen trace gas emissions from soils worldwide.Journal of Geophysical Research,101,1361–1377. Potter CS,Randerson JT,Field CB,Matson PA,Vitousek PM, Mooney HA,Klooster SA(1993)Terrestrial ecosystem produc-tion:a process model based on global satellite and surface data.Global Biogeochemical Cycles,7,811–841.
Prentice IC,Farquhar GD,Fasham MJR et al.(2001)The carbon cycle and atmospheric carbon dioxide.In:Climate Change2001: The Scienti?c Basis.Contribution of Working Group I to the Third Assessment Report of the Intergovernmental Panel on Climate Change(eds Houghton JT,Ding Y et al.),pp.183–237.Cam-bridge University Press,Cambridge.
Raich JW,Rastetter EB,Melillo JM,Kicklighter DW,Steudler PA, Peterson BJ(1991)Potential net primary productivity in South
T E R R E S T R I A L N I T R O G E N C Y C L E S I M U L A T I O N1763
r2008The Authors
Journal compilation r2008Blackwell Publishing Ltd,Global Change Biology,14,1745–1764
America:application of a global model.Ecological Application, 1,399–429.
Schimel DS,Braswell BH,Mckeown R,Ojima DS,Parton WJ, Pulliam W(1996)Climate and nitrogen controls on the geo-graphy and timescales of terrestrial biogeochemical cycling. Global Biogeochemical Cycles,10,677–692.
Schimel DS,Parton WJ,Kittel TGF,Ojima DS,Cole CV(1990) Grassland biogeochemistr:links to atmospheric processes. Climate Change,17,13–25.
Schipper LA,Cooper AB,Harfoot CG,Dyck WJ(1993)Regula-tors of denitri?cation in an organic riparian soil.Soil Biology& Biochemistry,25,925–933.
Schlesinger WH(1991)Biogeochemistry:An Analysis of Global Change.Academic,San Diego,CA.
Scott NA,Binkley D(1997)Foliage litter quality and annual net N mineralization:comparison across North American forest sites.Oecologia,111,151–159.
Sierra J(2002)Nitrogen mineralization and nitri?cation in a tropical soil:effects of?uctuating temperature conditions.Soil Biology&Biochemistry,34,1219–1226.
Sitch S(2000)The role of vegetation dynamics in the control of atmospheric CO2content.PhD thesis,Lund University,Sweden. Sitch S,Smith B,Prentice IC et al.(2003)Evaluation of ecosystem dynamics,plant geography and terrestrial carbon cycling in the LPJ dynamic global vegetation model.Global Change Biology,9,161–185.
Smith B,Prentice IC,Sykes MT(2001)Representation of vegeta-tion dynamics in the modeling of terrestrial ecosystems: comparing two contrasting approaches within European cli-mate space.Global Ecology&Biogeography,10,621–637. Strong DT,Fillery IRP(2002)Denitri?cation response to nitrate concentrations in sandy soils.Soil Biology&Biochemistry,34, 945–954.
Thonicke K,Venevsky S,Sitch S,Cramer W(2001)The role of?re disturbance for global vegetation dynamics:coupling?re into
a dynamic Global Vegetation Model.Global Ecology&Biogeo-graphy,10,661–677.
Tiedje JM,Sexstone AJ,Parkin TB,Revsbech NP(1984)Anaero-bic processes in soil.Plant and Soil,76,197–212.
Tietema A,Verstraten JM(1991)Nitrogen cycling in an acid forest ecosystem in the Netherlands under increased atmo-spheric nitrogen input.Biogeochemistry,15,21–46.
Van Drecht G,Bouwman AF,Knoop JM,Beusen AHW,Meinardi CR(2003)Global modeling of the fate of nitrogen from point and nonpoint sources in soils,groundwater,and surface water. Global Biogeochemical Cycles,17,1115,doi:10.1029/ 2003GB002060.
Vitousek PM,Cassman K,Cleveland C et al.(2002)Towards an ecological understanding of biological nitrogen?xation.Bio-geochemistry,57,1–45.
Walvoord MA,Phillips FM,Stonestrom DA,Evans RD,Hart-sough PC,Newman BD,Striegl RG(2003)A reservoir of nitrate beneath desert soil.Science,302,1021–1024.
Weier KL,Doran JW,Power JF,Walter DT(1993)Denitri?cation and the dinitrogen/nitrous oxide ratio as affected by soil water,available carbon,and nitrate.Soil Science Society of America Journal,57,66–72.
Well R,Augustin J,Meyer K,Myrold DD(2003)Comparison of ?eld and laboratory measurement of denitri?cation and N2O production in the saturated zone of hydromorphic soils.Soil Biology&Biochemistry,35,783–799.
Zechmeister-Boltenstern S,Hahn M,Meger S,Jandl R(2002) Nitrous oxide emissions and nitrate leaching in relation to microbial biomass dynamics in a beech forest soil.Soil Biology &Biochemistry,34,823–832.
Zhu W-X,Carreiro MM(2004)Temporal and spatial variations in nitrogen transformations in deciduous forest ecosystems along an urban–rural gradient.Soil Biology&Biochemistry,36,267–278. Zobler L(1986)A world soil?le for global climate modeling.NASA Technical Memorandum,87802,32.
1764X U-R I&I.C.P R E N T I C E
r2008The Authors
Journal compilation r2008Blackwell Publishing Ltd,Global Change Biology,14,1745–1764