3-D SPH simulations of colliding winds in eta Carinae

a r
X
i
v
:08
3
.
3
9
7
7
v
1
[
a
s
t
r
o
-
p
h
]
2
7
M
a
r
2
8
Massive Stars as Cosmic Engines Proceedings IAU Symposium No.250,2008F.Bresolin,P.A.Crowther &J.Puls,eds.c 2008International Astronomical Union DOI:00.0000/X000000000000000X 3-D SPH simulations of colliding winds in ηCarinae Atsuo T.Okazaki 1,Stanley P.Owocki 2,Christopher M.P.Russell 3,and Michael F.Corcoran 41Faculty of Engineering,Hokkai-Gakuen University,Toyohira-ku,Sapporo 062-8605,Japan email:okazaki@elsa.hokkai-s-u.ac.jp 2Bartol Research Institute,University of Delaware,Newark,19716DE,USA email:owocki@https://www.sodocs.net/doc/af8576387.html, 3Department of Physics and Astronomy,University of Delaware,Newark,19716DE,USA email:crussell@https://www.sodocs.net/doc/af8576387.html, 4Universities Space Research Association,Goddard Space Flight Center,Greenbelt,MD 20771,USA email:corcoran@https://www.sodocs.net/doc/af8576387.html, Abstract.We study colliding winds in the superluminous binary ηCarinae by performing three-dimensional,Smoothed Particle Hydrodynamics (SPH)simulations.For simplicity,we assume both winds to be isothermal.We also assume that wind particles coast without any net external forces.We ?nd that the lower density,faster wind from the secondary carves out a spiral cavity in the higher density,slower wind from the primary.Because of the phase-dependent orbital motion,the cavity is very thin on the periastron side,whereas it occupies a large volume on the apastron side.The model X-ray light curve using the simulated density structure ?ts very well with the observed light curve for a viewing angle of i =54?and φ=36?,where i is the inclination angle and φis the azimuth from apastron.Keywords.stars:luminous blue variable,winds –hydrodynamics –methods:numerical –bi-naries:general
2 A.T.Okazaki,S.P.Owocki,C.M.P.Russell,&M.F.Corcoran
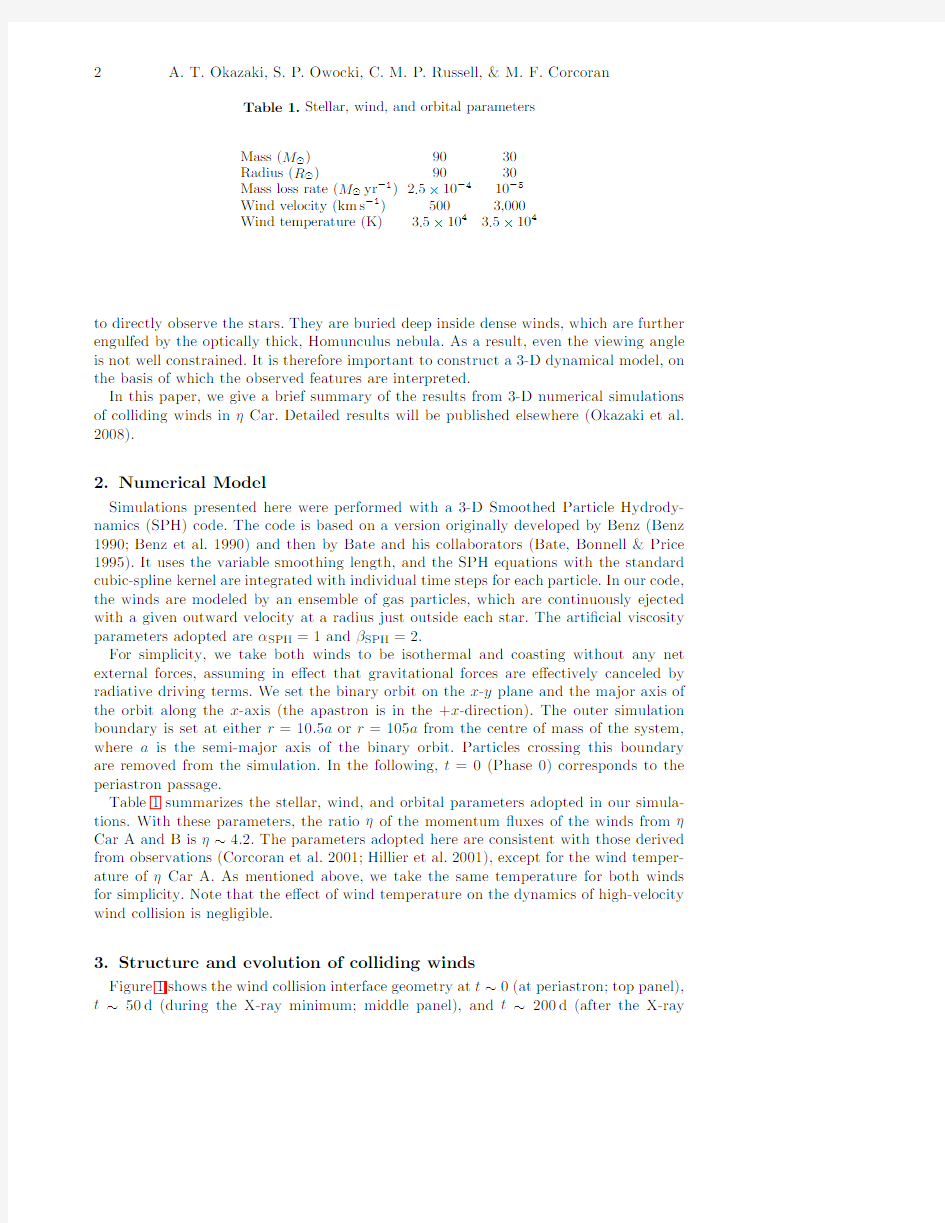
Table1.Stellar,wind,and orbital parameters
Mass(M⊙)9030
Radius(R⊙)9030
Mass loss rate(M⊙yr?1)2.5×10?410?5
Wind velocity(km s?1)5003,000
Wind temperature(K)3.5×1043.5×104
to directly observe the stars.They are buried deep inside dense winds,which are further engulfed by the optically thick,Homunculus nebula.As a result,even the viewing angle is not well constrained.It is therefore important to construct a3-D dynamical model,on the basis of which the observed features are interpreted.
In this paper,we give a brief summary of the results from3-D numerical simulations of colliding winds inηCar.Detailed results will be published elsewhere(Okazaki et al. 2008).
2.Numerical Model
Simulations presented here were performed with a3-D Smoothed Particle Hydrody-namics(SPH)code.The code is based on a version originally developed by Benz(Benz 1990;Benz et al.1990)and then by Bate and his collaborators(Bate,Bonnell&Price 1995).It uses the variable smoothing length,and the SPH equations with the standard cubic-spline kernel are integrated with individual time steps for each particle.In our code, the winds are modeled by an ensemble of gas particles,which are continuously ejected with a given outward velocity at a radius just outside each star.The arti?cial viscosity parameters adopted areαSPH=1andβSPH=2.
For simplicity,we take both winds to be isothermal and coasting without any net external forces,assuming in e?ect that gravitational forces are e?ectively canceled by radiative driving terms.We set the binary orbit on the x-y plane and the major axis of the orbit along the x-axis(the apastron is in the+x-direction).The outer simulation boundary is set at either r=10.5a or r=105a from the centre of mass of the system, where a is the semi-major axis of the binary orbit.Particles crossing this boundary are removed from the simulation.In the following,t=0(Phase0)corresponds to the periastron passage.
Table1summarizes the stellar,wind,and orbital parameters adopted in our simula-tions.With these parameters,the ratioηof the momentum?uxes of the winds fromηCar A and B isη~4.2.The parameters adopted here are consistent with those derived from observations(Corcoran et al.2001;Hillier et al.2001),except for the wind temper-ature ofηCar A.As mentioned above,we take the same temperature for both winds for simplicity.Note that the e?ect of wind temperature on the dynamics of high-velocity wind collision is negligible.
3.Structure and evolution of colliding winds
Figure1shows the wind collision interface geometry at t~0(at periastron;top panel), t~50d(during the X-ray minimum;middle panel),and t~200d(after the X-ray
Colliding winds inηCarinae3
Figure1.Wind collision interface geometry at t~0(top),t~50d(middle),and t~200d (bottom)for r 10a.In each panel,the greyscale plot shows the density in the orbital plane (left)and the plane which is perpendicular to the orbital plane and through the major axis of the orbit(right),on a logarithmic scale with cgs units.The dark spot near the origin represents the primary,while the small dark spot close to the apex of the lower density wind represents the secondary.Annotations in each panel give the time(in days)from periastron passage and the numbers of particles in the primary wind,N1,and in the secondary wind,N2. minimum;bottom panel)in a simulation covering r 10.5a.In each panel,the greyscale plot shows the density in the orbital plane(left panel)and the plane perpendicular to the
4 A.T.Okazaki,S.P.Owocki,C.M.P.Russell,&M.F.Corcoran
orbital plane and through the major axis of the orbit(right panel),on a logarithmic scale with cgs units.The dark spot near the origin represents the primary(ηCar A),while the small dark spot close to the apex of the lower density wind represents the secondary (ηCar B).
Although the wind collision interface in the simulation exhibits variations from insta-bilities,its global shape is easily traced and illustrates how the lower density,faster wind from the secondary makes a cavity in the higher density,slower wind from the primary. As expected,the shape of the collision interface around apastron,where the orbital speed of the secondary is only~20km s?1with respect to the primary,is in agreement with the analytical one(e.g.,Antokhin et al.2004).As the secondary approaches the periastron, the interface begins to bend,and at phases around periastron,where the orbital speed of the secondary is~360km s?1with respect to the primary,the lower density wind from the secondary makes a thin layer of cavity along the orbit.Then,the thickness of the cavity increases as the secondary moves away from periastron.
In order to study the wind collision interface geometry on a larger scale,we have performed a simulation covering r 105a.Figure2(a)shows the2-D density maps in the orbital plane and the plane perpendicular to it at the same phase(Phase0.1)as that of the bottom panel of Fig.1.The3-D interface geometry is shown in Fig.2(b) by the logarithmic density plot.From Fig.2,we note that the lower density wind from the secondary carves out a large-scale,spiral cavity in the higher density wind from the primary.The shape of the cavity is very asymmetric.It is just a thin layer on the periastron side with respect to the primary,whereas it occupies a large volume on the apastron side.
It is interesting to study whether the model presented here can explain the variability in the RXTE X-ray light https://www.sodocs.net/doc/af8576387.html,ing the density distribution in our r=10a simulation, Russell et al.(2008)modeled the X-ray light curve and compared it with the observed light curve.Assuming that the X-ray emission occurs at the head of the wind-wind inter-action cone located at D/(1+√
Colliding winds inηCarinae5
(a)
(b)
Figure2.Wind collision interface geometry at t~200d within r=100a:(a)2-D density maps in the orbital plane(left)and the plane perpendicular to the orbital plane and through the major axis of the orbit(right)and(b)the3-D plot of the logarithmic density.
via Grant-in-Aid for Scienti?c Research(16540218).SPH simulations were performed on HITACHI SR11000at Hokkaido University Information Initiative Center.
References
Antokhin,I.I.,Owocki,S.P.,&Brown,J.C.2004,ApJ,611,434
Bate,M.R.,Bonnell,I.A.,&Price,N.M.1995,MNRAS,285,33
Benz,W.1990,In:J.R.Buchler(ed.),The Numerical Modelling of Nonlinear Stellar Pulsations (Dordrecht:Kluwer),p.269
Benz,W.,Bowers,R.L.,Cameron,A.G.W.,&Press,W.H.1990,ApJ,348,647
Corcoran,M.F.,Ishibashi,K.,Swank,J.H.,&Petre,R.2001,ApJ,547,1034
Corcoran,M.F.2005,AJ,129,2018
Damineli,A.1996,ApJ,460,L49
Hillier,D.J.,Davidson,K.,Ishibashi,K.,&Gull,T.2001,ApJ,553,837
6 A.T.Okazaki,S.P.Owocki,C.M.P.Russell,&M.F.Corcoran
https://www.sodocs.net/doc/af8576387.html,parison of RXTE data(black and gray lines;see Corcoran2005)with the closest match model light curve(less-jaggy gray line).The light gray line shows the?rst cycle of RXTE data shifted by one period.Taken from Russell et al.(2008).
Ishibashi,K.,Corcoran,M.F.,Davidson,K.,Swank,J.H.,Petre,R.,Drake,S.A.,Damineli,A., &White,S.1999,ApJ,524,983
Okazaki,A.T.,Bate,M.R.,Ogilvie,G.I,&Pringle,J.E.2002,MNRAS,337,967
Okazaki,A.T.,Owocki,S.P.,Russell,C.M.P.,&Corcoran,M.F.2008,in preparation Russell,C.M.P.,Owocki,S.P.,&Okazaki,A.T.2008,these proceedings
Discussion
Davidson:Four essential points.
(a)One cannot derive useful orbit parameters for this object from Doppler velocities, because every available spectral feature evolves in a complex way.Eccentricity0.9is possible but not established.
(b)Several years ago,Kazunori Ishibashi proposed an orbit orientation based on the X-rays.It roughly matched the parameters you adopted.
(c)ηCar’s spectroscopic events are not primarily eclipses,not even eclipses by the wind.He II,He I,near IR,photometry,and X-ray?ares all show that something far more interesting is involved.See J.Martin et al.2006,ApJ and references therein. (d)The wind-wind collision region is at low latitudes but nearly all of the primary wind is polar(except during an event!).
Kudritzki:The X-ray dip is not an eclipse in the classical stellar sense,but rather a “wind eclipse”or an interval when the X-ray emission from the wind-wind collision is embedded in the dense wind from the primary.
Okazaki:Studying the e?ect of such an asymmetry in the primary wind on the in-teraction geometry is interesting.It is easy to implement the wind asymmetry in my code.