Computer_Simulation_of_coating_Process_with_monochromatic_monitoring
Computer simulation of coating processes with monochromatic
monitoring
A.Z?ller, M. Boos, H. Hagedorn,
B. Romanov
Leybold Optics GmbH, Siemensstrasse 88, 63755 Alzenau, Germany
ABSTRACT
For the production of high performance multilayer systems optical monitoring is essential. Substantial progress was achieved by the introduction of direct monitoring on the rotating substrate holder. It is a complex task to develop a stable monitoring strategy for multilayers with a large number of layers and irregular thicknesses. The verification and improvement requires the feedback of more or less numerous real coating runs. This expensive and time consuming trial and error method can be reduced significantly by computer simulation of coating runs.
A new software tool which simulates the coating process with monochromatic optical monitoring is introduced. Process instabilities are described by systematic and random errors of the deposition rate, refractive indices, etc. For the simulation of the monitoring curve real monochromatic bandwidth, signal noise, measurement frequency, etc. are taken into account. A UV-IR cut filter and a single notch filter design were simulated with virtual deposition runs. In both cases the simulation results were confirmed by real coating processes.
Keywords: Optical monitoring, intermittent monitoring, plasma-IAD, magnetron sputtering, optical coatings, computer simulation, virtual deposition
1.INTRODUCTION
With state of the art monochromatic monitoring systems the variation of the transmission or reflectance at a selected single wavelength is measured with high accuracy. The layer cut-off condition is coupled to turning-points and therefore linked to the optical thickness. A lot of different direct and indirect monitoring strategies are used in production. Many publications deal with theoretical and practical aspects of optical monitoring1,2,,3. Pre-production analysis of optical coating manufacturability with monochromatic monitoring was described in reference 5. Substantial progress was achieved by the introduction of direct monitoring on the rotating substrate holder 4 . High accuracy monochromatic monitoring takes advantage of error compensation effects in many cases, but also error accumulation may take place. The stability of the monitoring depends on the monitor wavelengths and potential test glass changes. Sometimes it even makes sense to modify the layer design in order to improve the monitoring stability. It is a complex task to develop a stable monitoring strategy for multilayers with a large number of layers and irregular thicknesses. The verification and improvement requires the feedback of more or less numerous real coating runs. In this paper a new software tool which simulates the coating process with monochromatic optical monitoring using the optical monitor type OMS 5000 from Leybold Optics is introduced.
2.SIMULATION CAPABILITIES
The basic system and the monitoring capabilities of the OMS 5000 are already described 6. The simulation tool communicates with the original OMS 5000 software which is used on the coating machine. Regarding the optical monitor therefore the simulation is very close to the real coating process. Process instabilities are described by systematic and random errors of the deposition rate, refractive indices, etc. For the simulation of the monitoring curve real monochromatic bandwidth, signal noise, measurement frequency, etc. are taken into account. Also the optical monitoring parameters like signal averaging, monochromatic slit width, trigger point algorithm, etc. can be
specified. Multiple simulated deposition runs can be performed. The simulated monitor curves, the resulting layer thickness errors and the spectra after each layer are recorded and displayed graphically.
2.1 Software structure
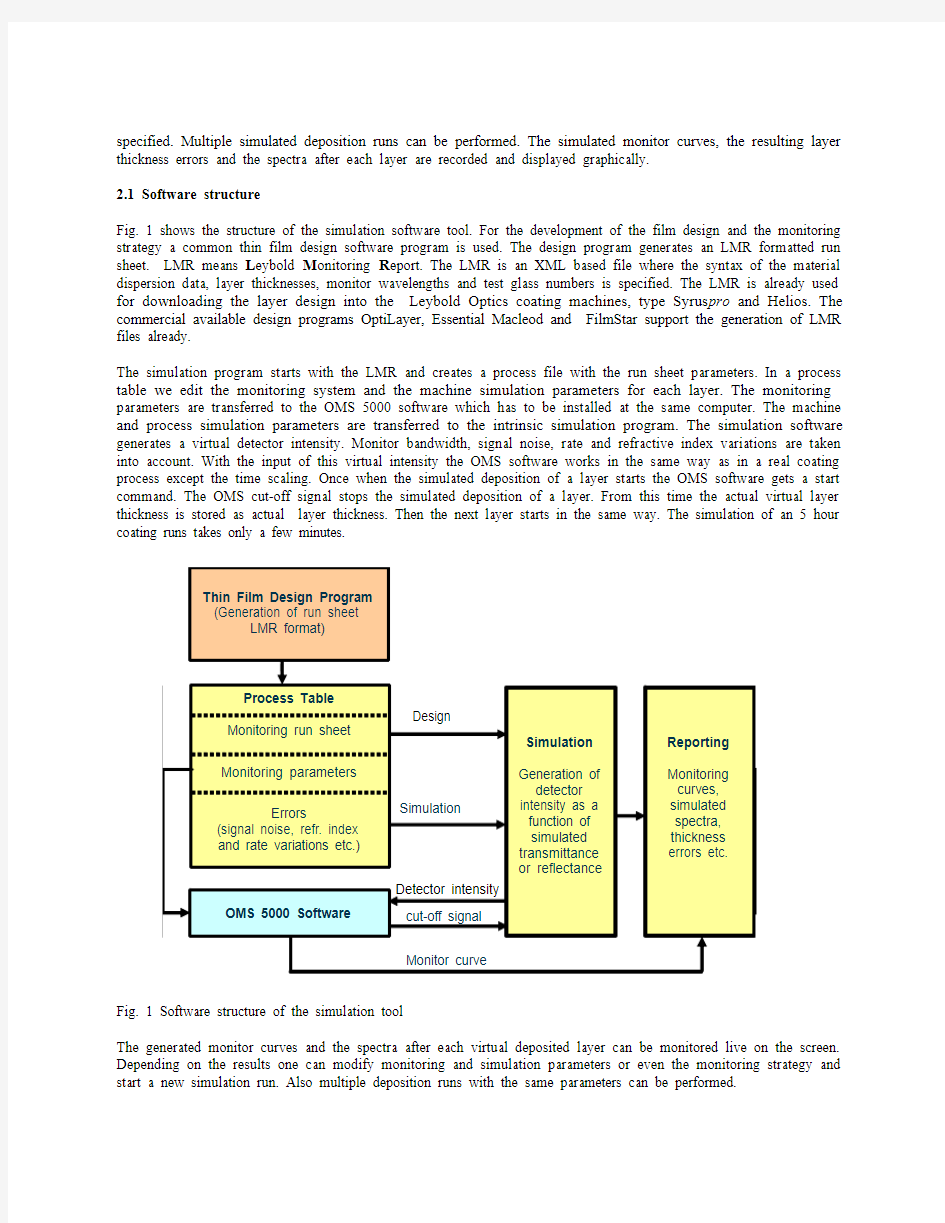
Fig. 1 shows the structure of the simulation software tool. For the development of the film design and the monitoring strategy a common thin film design software program is used. The design program generates an LMR formatted run sheet. LMR means L eybold M onitoring R eport. The LMR is an XML based file where the syntax of the material dispersion data, layer thicknesses, monitor wavelengths and test glass numbers is specified. The LMR is already used for downloading the layer design into the Leybold Optics coating machines, type Syrus pro and Helios. The commercial available design programs OptiLayer, Essential Macleod and FilmStar support the generation of LMR files already.
The simulation program starts with the LMR and creates a process file with the run sheet parameters. In a process table we edit the monitoring system and the machine simulation parameters for each layer. The monitoring parameters are transferred to the OMS 5000 software which has to be installed at the same computer. The machine and process simulation parameters are transferred to the intrinsic simulation program. The simulation software generates a virtual detector intensity. Monitor bandwidth, signal noise, rate and refractive index variations are taken into account. With the input of this virtual intensity the OMS software works in the same way as in a real coating process except the time scaling. Once when the simulated deposition of a layer starts the OMS software gets a start command. The OMS cut-off signal stops the simulated deposition of a layer. From this time the actual virtual layer thickness is stored as actual layer thickness. Then the next layer starts in the same way. The simulation of an 5 hour coating runs takes only a few minutes.
Fig. 1 Software structure of the simulation tool
The generated monitor curves and the spectra after each virtual deposited layer can be monitored live on the screen. Depending on the results one can modify monitoring and simulation parameters or even the monitoring strategy and start a new simulation run. Also multiple deposition runs with the same parameters can be performed.
The simulation tool effectively helps to compare different monitoring strategies and to optimize the monitoring parameters. Also one can find out the critical monitoring and process parameters.
The monitoring parameters basically contain the measurement frequency, the monochromatic bandwidth and signal averaging parameters. Also several trigger point cut-off algorithm are programmed in the OMS and can be selected. The process variations are described by the signal noise of the optical monitor and systematic and random errors of the deposition rates, refractive indices and source shutter delays.
3.SIMULATION APPLICATIONS
3.1UV-IR cut filter
The reproducibility of a UV-IR cut filter with 42 alternating TiO2/SiO2 layers was investigated in a SYRUS pro 1100 box coater with APSpro plasma source. Two different monitor wavelengths were used. The deposition rates were 0,5 nm/s for the TiO2 and 0,8 nm/s for the SiO2. Five consecutive production runs were done. Direct monitoring on the rotating substrate holder was applied. The experimental set-up and the reproducibility experiment of the real coating runs were described in reference 4 already.
1
3
5
7
911
13
15
17
19
21
23
25
27
29
31
33
35
37
39
41
layer number
r e f r a c t i v e i n d e x e r r o r s
Fig 4 Simulated refractive index errors Fig 5 Thickness errors of a virtual deposition run
Figure 4 shows the simulated refractive index errors of the H-index material of one simulation run. According to the assumption in table 1 the refractive index is app. 1 % higher in average. The statistical variations between 0.7% and 1.6% may be higher in other simulation runs since the statistical distribution increases with the number of samples. Figure 5 illustrates the errors of the optical thickness of the individual layers of this virtual coating run. The thickness errors are caused by monitoring errors and the assumed process and machine variations. Also there are very complex interactions between the different types of errors and the cut-off algorithm of the OMS 5000. This may lead to error compensation or error accumulation effects. The nominal physical thickness of the 1st layer is app. 10 nm only while the refractive index was simulated 1.6 % higher than the theory. Since the monitor curve doesn’t pass through an extremum the refractive index error cannot be compensated in this case. Therefore the optical thickness of the first layer app. is 2.8 % lower than the theory. As shown in figure 3 the 2nd layer stops at a trigger-point after a minimum is passed. The optical thickness of this layer which was assumed w/o refractive index error is app. 1 % higher than the theory. It seems that the thickness error of the 1st layer is compensated at least partly by the 2nd layer. For the following layers it is very difficult to explain the simulated thickness errors because very complex interactions between the actual layer and errors of the previous layers take place.
350
400450500550600650700750800Wavelength (nm)T r a n s m i t t a n c e (%)
635
640645650655660665
670
Wavelength (nm)
T r a n s m i t t a n c e (%)
Fig 6 Optical performance of 5 virtual coating runs of a 42 layer UV-IR cut filter
Figure 6 shows the optical performance of 5 simulated coating runs. Low variations of the performance indicate a stable process. The variation of the wavelength of the transmittance edge is app. 1 nm only. On the basis of the thickness errors illustrated in figure 5 one would expect a worse result. Error compensation effects may take place.
The process and monitoring stability was confirmed by the results of 5 consecutive real coating runs. Figure 7 shows the equivalent results of the monitor glasses. The variations of the transmittance edge is in the same range as simulated. Also the optical performance is very similar to that of the simulations. The statistical variations of the real coatings seem to be larger than the virtual coating runs. The error assumptions may be too optimistic.
350
400450500550600650700750800Wavelength (nm)
T r a n s m i t t a n c e (%)
635
640645650655660665670
Wavelength (nm)
T r a n s m i t t a n c e (%)
Fig 7 Monitor glass performance of 5 real coating runs of a 42 layer UV-IR cut filter
3.2 Notch Filter coating
A single notch filter coating with alternating niobia/silica layers was designed and produced with plasma assisted reactive magnetron sputtering. Figure 8 shows the theoretical performance of the filter.
The notch width of 16nm at 532nm reference wavelength and a blocking range of 6nm with an optical density OD > 3.5 led to a multilayer with 140 layers and a total physical thickness of app. 15μm. The transmittance pass band was specified in the range between 400nm and 520nm respectively 545nm and 700nm. The design consists of relatively thick niobia and very thin silica layers. Figure 9 illustrates the structure of the layer thicknesses. The total thickness
of silica was < 1μm with a main thickness range between 3 and 12 nm.
380
430
480
530
580
630
680
Wavelength (nm)
T r a n s m i t t a n c e (%)
20
22
24
26
28
30
32
34
36
38
40
42
44
46
48
50
layer number
l a y e r t h i c k n e s s (n m )
Fig. 8 Theoretical performance of the single notch filter Fig. 9 Layers thickness structure of the design
layer number t h i c k n e s s e r r o r (n m )
layer number
t h i c k n e s s e r r o r (n m )
Fig. 10: Thickness errors of the simulation with Fig. 11: Thickness errors of the simulation with Trigger-point algorithm 1 trigger-point algorithm 2
The simulation tool was used, to investigate different trigger-point cut-off algorithms. In a first approach a simple offset correction algorithm was simulated. In this case the trigger-point is just shifted by the difference between theory and actual monitor intensity while the scaling is not corrected (algorithm 1). Figure 10 shows the virtual thickness errors of the fist 50 layers of a simulated coating run with algorithm 1. In another simulation a more sophisticated algorithm with offset and scaling correction was applied (algorithm 2). Figure 11 shows the simulated thickness errors of the first 50 layers with algorithm 2. It is clear that case 2 is the better solution. This is confirmed by the resulting simulated spectra which are compared in figure 12. Figure 13 shows the performance of 2 consecutive real coating runs which were performed in a magnetron sputtering system, type Helios. This outstanding performance is the result of the accurate monitoring and the stable process of the Helios sputtering system, which allows to control very thin layers with high accuracy. The total process time including handling was < 11 hours. More details of the process are described in another paper at the same conference 7.
380
430480530580630680
Wavelength (nm)
T r a n s m i t t a n c e (%)
380
430480530580630680
Wavelength (nm)
T r a n s m i t t a n c e (%)
Fig.12 Comparison of algorithm 1 and algorithm 2 Fig.13 Performance of 2 consecutive real by simulation coating runs
4. CONCLUSIONS
A new software tool which simulates the coating process with monochromatic optical monitoring using the optical monitor, type OMS 5000 from Leybold Optics is introduced. Process instabilities are described by systematic and random errors. For the simulation of the monitoring curve real monochromatic bandwidth, signal noise and measurement frequency are taken into account. The simulation tool communicates with the original OMS 5000 software which is used on the coating machine. Regarding the optical monitor therefore the simulation is very close to the real coating process. The effort for expensive and time consuming test runs can be reduced significantly.
A UV-IR cut filter was simulated with error assumptions of a real coating process. An error discussion indicates error compensation effects. The optical performance of the virtual deposition runs is close to the results of 5 consecutive real coating runs.
A challenging notch filter was investigated by simulation and produced with a Helios magnetron sputtering system. The simulation was helpful to compare different trigger-point cut-off algorithms. The outstanding performance of real coating runs are the result of the accurate monitoring and the stable process of the Helios sputtering system, which allows to control very thin layers with high accuracy.
REFERENCES
[1] Mac Leod H. A., “Thin-Film Optical Filters”, IOP Publishing ISBN 0 7503 0688 2, 499-522 (1986)
[2] Willey R. R., “Practical Design and Production of Optical Thin Films,” Optical engineering (Marcel Dekker Inc.), 213 (1996)
[3] Tikhonravov A. V., M. K. Trubetskov, T. V. Amotchina, “Statistical approach to choosing a strategy of
monochromatic monitoring of optical coating production”, Appl. Opt. Vol. 45, No.30, 7863-7870 (2006) [4] Z?ller A. , Boos M., G?tzelmann R., Hagedorn H., Klug W., “ Substantial progress in optical monitoring by intermittent measurement technique”, SPIE Vol. 5963-13,, (2005)
[5] Tikhonravov A., Trubetskov, Kruschwitz J., Zoller A., Hagedorn H., Romanov B., Boos M. , "Software
Tools for Studying Optical Coating Manufacturability with Modern Monochromatic Monitoring Devices",
presented at SPIE's OptiFab, Rochester, NY., ,(2007).
[6] Z?ller A., Boos M., Hagedorn H., Klug W., Schmitt C., “ High Accurate In-situ Optical Thickness Monitoring for Multilayer Coatings”, SVC 47th ann. Conf. proc.,, (2004)
[7] Scherer M., Schallenberg U., Hagedorn H., Lehnert W., Romanov B., Z?ller A., “High performance Notch
Filter Coatings produced with PIAD and Magnetron Sputtering”, SPIE Vol. 7101-18,, (2008)