MSA Linearity 3rd
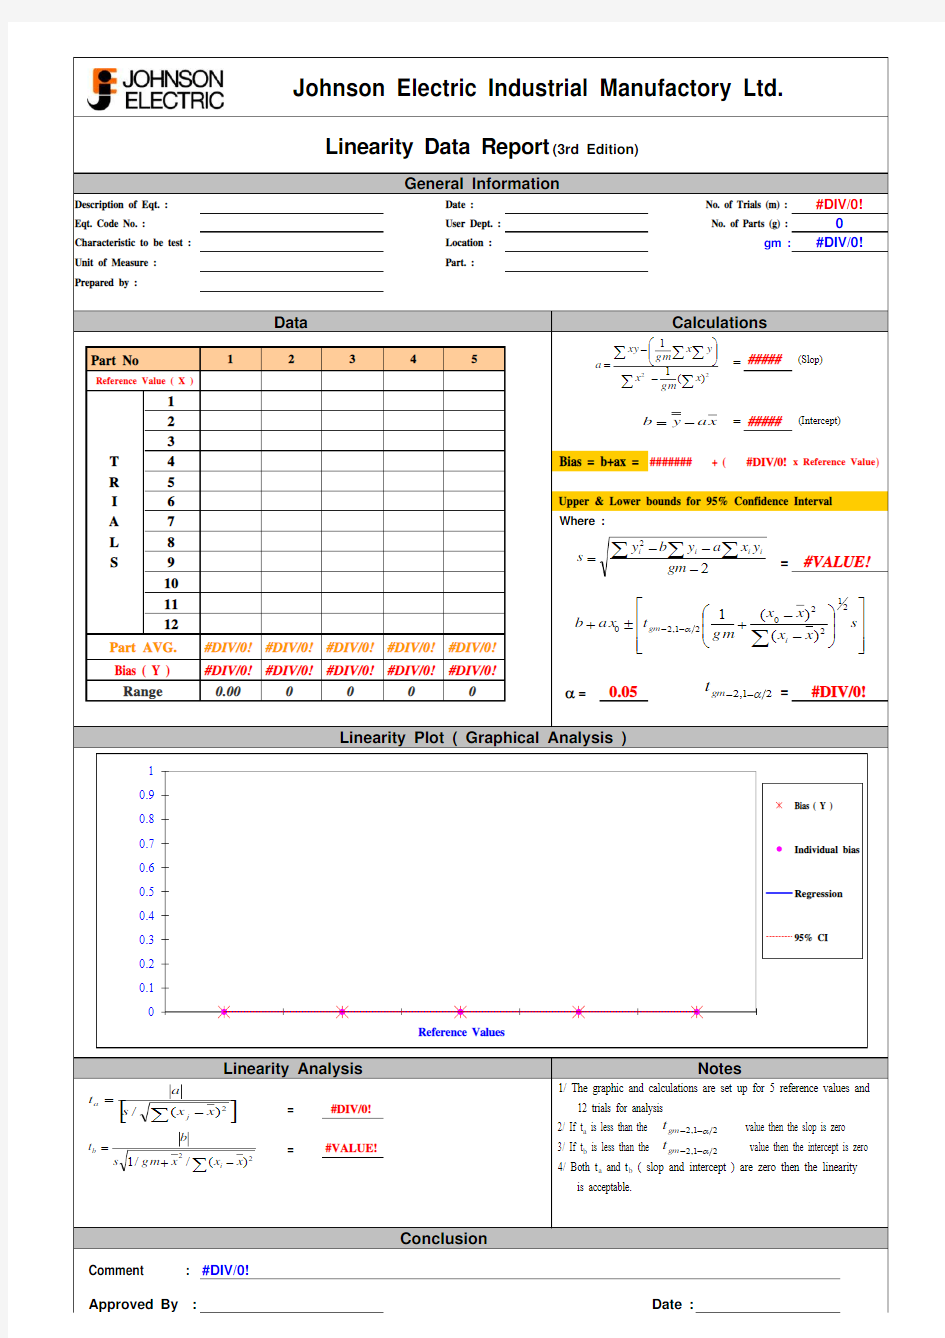

Johnson Electric Industrial Manufactory Ltd.
Description of Eqt. :Date :No. of Trials (m) :Eqt. Code No. :
User Dept. :No. of Parts (g) :
Characteristic to be test :Location :gm :
Unit of Measure :Part. :
Prepared by :
Data
Calculations
Part No
12
3
4
5
=#####
(Slop)
#DIV/0!1#DIV/0!2#DIV/0!=#####
(Intercept)
3#DIV/0!
T 4#DIV/0! Bias = b+ax =#######+ (
#DIV/0!x Reference Value )
R 5#DIV/0!
I 6#DIV/0! Upper & Lower bounds for 95% Confidence Interval A 7#DIV/0! Where :L 8#DIV/0!S
9#DIV/0!=
10#DIV/0!11#DIV/0!12
#DIV/0!
#DIV/0!#DIV/0!#DIV/0!#DIV/0!#DIV/0!#DIV/0!#DIV/0!#DIV/0!#DIV/0!#DIV/0!#DIV/0!
0.000000
a =0.05
=
Linearity Plot ( Graphical Analysis )
Linearity Analysis
Notes
1/ The graphic and calculations are set up for 5 reference values and =#DIV/0!#DIV/0! 12 trials for analysis
2/ If t a is less than the value then the slop is zero =
#VALUE!#VALUE!
3/ If t b is less than the value then the intercept is zero
4/ Both t a and t b ( slop and intercept ) are zero then the linearity is acceptable.
Conclusion
Comment :#DIV/0!
Approved By :
Date :
Reference Value ( X )
#VALUE!
Part AVG.Bias ( Y )Range
#DIV/0!
#DIV/0!
Linearity Data Report (3rd Edition)
General Information
#DIV/0!00
0.10.2
0.30.40.5
0.60.7
0.8
0.91B i a s
Reference Values
Bias ( Y )
Individual bias
Regression
95% CI
?????-÷÷????è?-=
2
2)(1
1x gm x y x gm xy a x
a y
b -=úúú?
ù
êêê?
é
÷
÷?
???è?--+±+?--s x x x x gm t ax b i gm 2
122
021,20)()(1a
2
2
---=
???gm y x a y b y
s i
i i i
2
1,2a
--gm t []
?-=
2
)(/
x x
s a
t j
a ?-+=
2
2
)(//1x x x gm s b
t i b 21,2a --gm t 21,2a --gm t