2019年雅思写作真题小作文
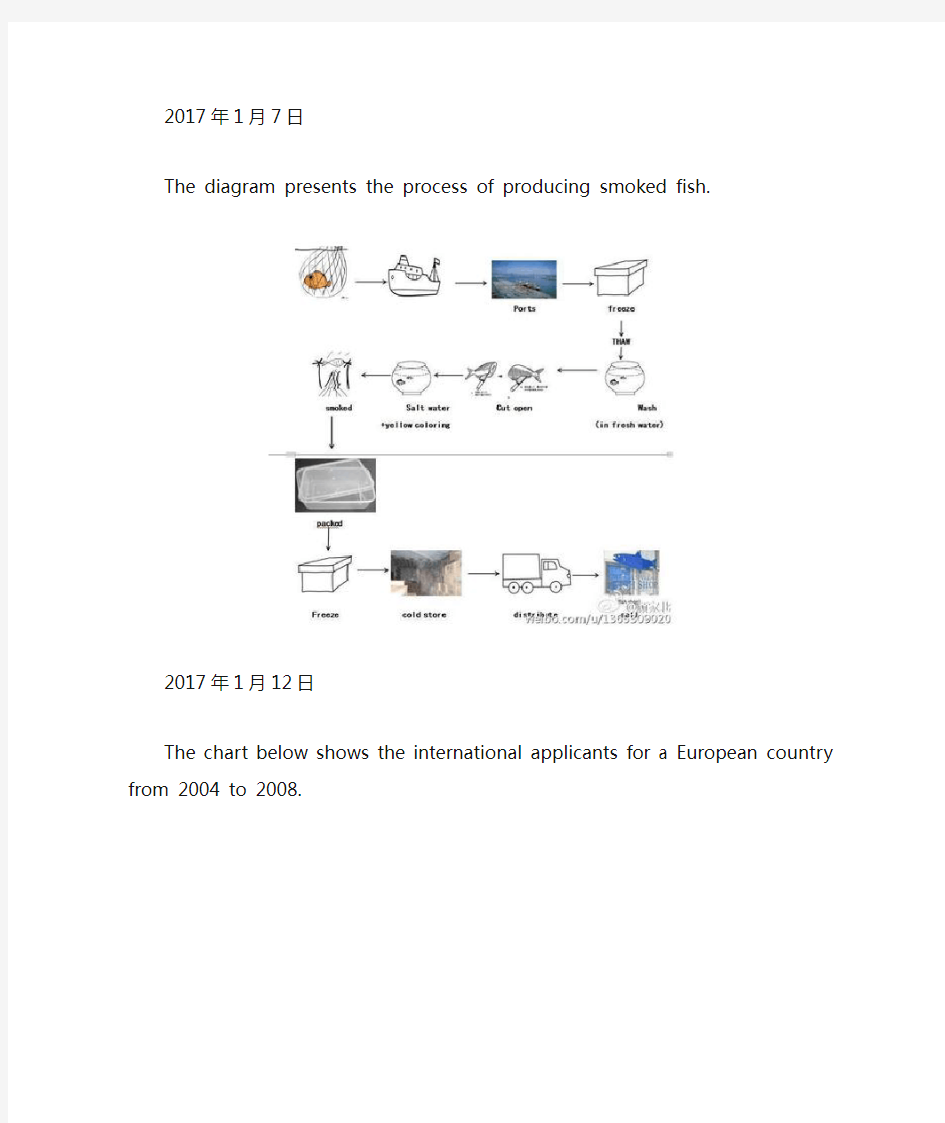

The diagram presents the process of producing smoked fish.
The chart below shows the international applicants for a European country from 2004 to 2008.
The table below shows the income and expenditure of Harckley Hall, a public place for hiring over the period of three years.
The chart below shoes the reasons why people stay in UK and leave UK.
The chart below shows the percentage of adults not doing physical exercise in Australia in 2005.
The chart below shoes the percentage of international students in Canada and USA, also compare the three top source of countries in Canada and USA.
The first chart shows the number of people per kilometer square of six countries in 2003. The second chart shows the percentage change of population in urban area of the six countries from 2003 to 2005.
The diagram presents the process of producing smoked fish.
The chart shows the percentage of dependents in total population in 5 countries, compared the number in 2000 and the projection in 2050.
The chart shows the percentages of both males and females who ate 5 kinds of fruits and vegetables per day of 7 age groups in the UK 2006.
The table below shows the employment rate and average annual salary of graduates from the Australian University.
The chart below shows the percentage of people using internet for different activities in an UK city of year 2007 and 2009.
This diagram shows the online activities of a particular city in Britain in the year of 2007 and 2009.
The diagrams below show the changes of a town called Bridgetown in 1700 and 2000.
The chart below gives information about the possession of newer technologies by different age groups in UK in 2009. Summarize important information and make comparison and contrast.
The diagrams shows a museum and its surroundings in 1900 and 2010.
The graph below shows the percentage of workers in 5 different European countries with a days or more illness absence from 1991 to 2001.
The chart below shows the destinations of students graduated from physics courses and Art & Design in a European country in 2007.
雅思写作-小作文范文-柱状图
雅思经典小作文柱状图4篇范文+写作要点分析 C1T3 题目 The chart below shows the amount of money per week spent on fast foods in Britain. The graph shows the trends in consumption of fast foods. Write a report a university lecturer describing the information shown below. The chart shows that high income earners consumed considerably more fast foods than the other income groups, spending more than twice as much on hamburgers (43 pence per person per week) than on fish and chips or pizza (both under 20 pence). Average income earners also favored hamburgers, spending 33 pence per person per week, followed by fish and chips at 24 pence, then pizza at 11 pence. Low income earners appear to spend less than other income groups on fast foods, though fish and chip remains their most popular fast food, followed by
2019年雅思写作小作文流程图解析及范文:废纸回收
2019年雅思写作小作文流程图解析及范文:废纸回收 The chart below shows the process of waste paper recycling. 范文: The flow chart shows how waste paper is recycled. It is clear that there are six distinct stages in this process, from the initial collection of waste paper to the eventual production of usable paper. At the first stage in the paper recycling process, waste paper is collected either from paper banks, where members of the public leave their used paper, or directly from businesses. This paper is then sorted by hand and separated according to its grade, with any paper that is not suitable for recycling being removed. Next, the graded paper is transported to a paper mill. Stages four and five of the process both involve cleaning. The paper is cleaned and pulped, and foreign objects such as staples are taken out. Following this, all remnants of ink and glue are removed from the paper at the de-inking stage. Finally, the pulp can be processed in a paper making machine, which makes the end product: usable paper. (160 words, band 9)
2010年雅思写作真题大汇总
Task One: two pie charts describing the percentages of the people staying in and movin g out of UK Task Two: Someone believes that a country should help its local residents, while others b elieve that the help should be given to the most needed. Discuss both of opinions and pr esent your opinion. 2010.01.14 Task One: a table describing the transportations of UK Task Two: Governments are more responsible for scientific research than private compan ies. To what extent do you agree or disagree? 2010. 01.23 Task One: a map describing the change of towns Task Two: The gap between the poor and rich gets larger. What cause the phenomeno n and how to solve it? 2010.1.30
Task One: a bar chart Task Two: Many people believe that there is a general increase in anti-social behaviour s and lack of respect for others. What cause the phenomenon and how to solve it? 2010.2.6 Task One: pie chart: the distribution of business time Task Two: Air travel is only beneficial to the richest people. To what extent do you agre e or disagree? 2010.2.20 Task One: three pie charts of course selection Task Two: Social development improves the living standard of the public. However, som e social values may get lost in the process. What are the advantages and disadvantage s of this phenomenon? 2010.2.27 Task One: table of British Population in three years
雅思小作文地图题
雅思小作文题型多样,其中就包括地图题,本文将详细讲解雅思小作文地图题写作技巧。评分标准 ?TA – Task Achievement 任务完成情况 ?CC – Coherence and Cohesion 意合与形合 ?LR – Lexical Resource 词汇资源 ?GRA – Grammatical Range and Accuracy 语法广度与精确度 审题 The map below shows the development of the village of Ryemouth between 1995 and present. 文章结构 第一段 交待写作目的 第二段 描述1995年的地图 第三段
拿现在的地图和95年的做对比 第四段 总结全文 第一段 This report compares how the village of Ryemouth has developed and changed since the year of 1995. 题目:The map below shows the development of the village of Ryemouth between 1995 and present. 第二段 As is clearly described in the first picture, Ryemouth was a coastal city which was divided into three parts by two roads. In the southern part, there was a fishing port on the sea, with a fish market located in the north and a coffee shop in the north-east. A block of shops was situated on the opposite side of the market… 第三段 In the second picture, the village changed a lot. The fishing port has been removed and the fish market is replaced by apartments. Several restaurants also occupy the place of the shops on the roadside. Moreover, a parking lot is newly built on the east of the hotel. In addition, … 第四段 Overall, based on the brief description above, it is clear that the general layout of the village does not change a lot, while some newly-built facilities and housing has ornamented the small village.
雅思写作小作文范文118篇之范文14
雅思写作小作文范文118篇之范文14 以下是三立在线雅思网给大家分享的雅思写作小作文范文118篇:范文14。希望对大家的雅思备考有所帮助,更多雅思备考资料欢迎大家随时关注三立在线雅思网。 范文14 The computer is widely used in education,and some people think teachers do not play important roles in the classroom. To what extend do you agree or disagree? In this period of communication,computer has been used in all kinds of fields widely, and plays a particular role in our lives. Especially computer has become more and more important in educational field, therefore dozens of people considered teachers could be replaced computers that will go with the current of the times. The above point is certainly wrong; this essay will outline three reasons. The main reason is that people’s brain better than computer. Firstly, people design all kinds of computer’s programs. Secondly, computer doesn’t have logistic ideation. Computer only can defend on that designer inputted computer’s programs to judge a question’s right or wrong. In other words, computer can’t defend on thinking that computer independently analyzes a question’s right or wrong. In case, designer inputted programs that are wrong. Computer output the result that also will be wrong. If this kind of problem happened in classroom, students would be infused plenty of wrong information.
2019雅思写作考试真题(1)
2019年12月17日雅思大作文真题及范文 Task:Some people think getting old is entirely bad, but other people do think it’s much better for old people to live now than in the past. Please show your idea with explanation, examples and your knowledge. Sample answer: It has become a common phenomenon for people in a number of countries to enjoy an increasing life expectancy. While some people believe it is horrible just to imagine getting old , I think the situation has completely changed comparing to decades ago and now elderly people can lead a happy life. In some cases, the seniors do experience empty nest syndrome because their children are away from home. However, things are different nowadays. There are numerous residential homes with trained carers in a country and they have become a perfect place for the elderly to stay after retirement, where the elderly will not feel lonely and bored with the company of their peers. Another concern for numerous senior citizens is the health problem. In the past, without advanced medical science, the seniors tend to suffer from various kinds of diseases, which decrease their quality of life at great extent. By contrast, the medical science is developing at an amazing speed and this trend can at least delay the onset of some chronic conditions and with healthy body, the elderly can enjoy happier lives.
雅思写作小作文题型与难点分析:秒杀图形描述题
雅思写作小作文题型与难点分析:秒杀图形描述题 图形描述题的难点之一是难以在短时间内找出该题需要表达的重点,其次缺乏此举,缺少书面表达的语言和亮点。对于题型出现的这 些难点,有一些相对应的建议,协助大家克服考试中出现的这些难点。 1、寻觅小作文需要表达的重点 见到图形表达题,你心中就需要思考这个图形题需要表述的重点 在哪里。作答时先说明再梳理数据。切不可将文章写成账本式的文字,否则,你就会得到很低的分数。 例如:The graph shows how the amount of water used worldwide changed between 1900 and 2000. Throughout the century, the largest quantity of water was used for agricultural Purposes, and this increased dramatically from about 500 km to around 3,000 km in the year 2000. 文章的主句应该对文章要表达的趋势,量的大小作出说明,相关 的数据则补充在后面。雅思(课程)小作文考察的精髓还是查看考生的 英文表达水平,精简凝练。你的描述要让阅卷者脑海中浮现出图形的 样本,数量和趋势等等相关变量。如果你能达到以上这些要求,那么 小作文本身也就基本上合格了。 2、了解图形的分类规律 图形描述题,按照标准图形来分,能够分为line graph (curve), bar chart, pie chart以及table,按照表达重点来分,分为趋势类和 大小类,分类依据于题中的时间列表。一般来说,出现时间段的图形 题都是以描述数据变化趋势为主。 3、准备必要的表达方式 1. 与趋势相关的词语:
雅思写作小作文练习_翻译
1. 该表格描述了在...年之...年间...数量的变化。 2. 该柱状图展示了... 3. 该图为我们提供了有关...有趣数据。 4. 该图向我们展示了... 5. 该线形图揭示了... 6. 这个曲线图描述了...的趋势。 7. 数据(字)表明... 8. 该树型图向我们揭示了如何... 9. 该数据(字)可以这样理解... 10. 这些数据资料令我们得出结论... 11. 如图所示... 12. 根据这些表(数字)... 13. 如表格所示... 14. 从图中可以看出,...发生了巨大变化。 15. 从图表我们可以很清楚(明显)看到... 16. 这个图表向我们展示了... 17. 该表格描述了...年到...年间a与b的比例关系。 18. 该图描述了...总的趋势。 19. 这是个柱型图,描述了...
20. 如图所示,两条曲线描述了...的波动情况。 21. 在...至...期间,...基本不变。 22. 在...年到...的期间 23. 1995年至1998三年里... 24. 从那时起... 25. ...月(年)至...月(年)...的数量基本不变。 26. 数字急剧上升至... 27. ...至...期间...的比率维持不变。 28. ...的数目在...月(年)达到顶点,为... 29. 比率维持在... 30. ...的比例比...的比例略高(低)。 31. ...与...的区别不大。 32. 该图表表明...的数目增长了三倍。 33. ...逐年减少,而...逐步上升。 34. ...的情况(局势)到达顶(高)点,为...百分点。 35. 数字(情况)在...达到底部。 36. 数字(情况)达到底部(低谷)。 37. a是b的...倍。 38. a增长了...
2014雅思写作A类大作文真题汇总
2014年雅思写作真题汇总【A类】 1. Some people think the best way to solve traffic congestions in cities is to provide free public transport 24 hours a day, 7 days a week. To what extent do you agree or disagree? 【2014.01.09】 2. Nowadays many young people in work force change their jobs or careers every few years. What do you think are the reasons for this? Do the advantages outweigh disadvantages? 【2014.01.11】 3. Many children find it is difficult to concentrate or pay attention at school. What are the causes? What are the possible solutions to this problem? 【2014. 01.18】 4.The international community should immediately reduce the consumption of fossil fuels of all countries. To what extent do you agree or disagree? 【2014. 01.25】 5. Some people believe the best way to produce a better society is to ensure there is only a small difference between the earnings of the richest and the poorest. To what extend do you agree or disagree? 【2014. 02. 01】 6. Many people think the painting and music do not directly improve the quality of people, and therefore the government should not spend the money on arts, and they should spend more money on the construction of public facilities. To what extent do you agree or disagree? 【2014. 02.13】 7. Some people think success of life is based on hard work and determination but others think there are more important factors like money and appearance. Discuss both sides and give your own opinion? 【2014. 02.15】 8. Children’s education is expensive. In some countries, the government pay some of or all of the costs. Do the advantages outweigh its disadvantages? 【2014.02.22】 9. Some people think living in big cities is bad for people's health. To what extent do you agree or disagree? 【2014. 03. 01】 10. Some people think young people should be required to have full time education until they are at least 18 years old. To what extent do you agree or disagree? 【2014. 03.08】
雅思写作小作文饼图真题句子练习PieSentences
雅思写作小作文饼图真题句子练习P i e S e n t e n c e s It was last revised on January 2, 2021
P i e c h a r t In 1980 Australia used coal as the main electricity source(50 units) and the remainder was produced from natural gas, hydro power(each producing 20 units) and oil,which produced only 10 units. 在1980年,澳大利亚使用煤作为主要的电力来源(50 units),剩下的电力由天然气,氢能(两者各产生20 units)和石油,它仅仅只产生10 units。 By 2000, coal had become the fuel for more than 75% of electricity produced and only hydro continued to be another significant source supplying approximately 20%. 到了2000年,煤已经成为了产生超过75%电力的能源了,同时只有氢能继续成为另一个重要的供应来源,大约是20%。 In contrast, France used coal as a source for only 25 units of electricity in 1980, which was matched by natural gas. 相比之下,法国在1980年用煤供电只有25 units,这和天然气相同。 The remaining 40 units were produced largely from oil and nuclear power, with hydro contributing only 5 units. 剩下的40 units 主要都产生于石油和核能,其中氢能只贡献了5 units。 But by 2000 nuclear power, which was not used at all in Australia, had developed into the main source, producing almost 75% of electricity, at 126 units, while coal and oil together produced only 50 units.
作文范文之雅思小作文table
作文范文之雅思小作文table
雅思小作文table 【篇一:雅思小作文表格图实例分析】 雅思小作文表格图实例分析 朗阁海外考试研究中心 表格图是雅思小作文的常考图形之一,也是烤鸭们在备考时必须要准备的一类题型。那么烤鸭们具体应该如何准备表格图呢?下面,朗阁海外考试研究中心的专家将以一道具体的实例,就这一题型的解题思路和步骤做出详尽的分析和解答。 the table below shows personal savings as a percentage of personal income for selected countries in 1989, 1999 and 2009. personal savings as a percentage of personal income 一、审题,决定大体写作方式 首先,读题目,了解到这幅表格图是关于“几个国家的人民个人收入中存款的百分比”以及三个时间点(据此,正文部分描述存款率是时态基调为过去时)。表格上方的title和题目表述一样,没有额外信息,因此,读一遍即可。 然后,审具体表格,决定大致写作方向和方式,即分段方式。表格的审图需要注意以下几个方面:横轴,纵轴和总体数据特征。此图中的横纵轴分别是时间和7个研究对象——7个国 家。横纵轴中间有一栏为时间,那说明,此图原则上应该按曲线图原理来写——即,描述7个国家存款率上升或下降趋势;但是,经过下一步对表格中数据总体特征的总结发现:7个国家的存款率在这一段时间内总体呈现下降趋势。这一发现说明,如果继续按照曲线图原理描述,文章会非常单调,而且对比的空间也不大;相反,同一年份里,
雅思小作文写作教学提纲
雅思小作文写作
Writing Notes Date: July, 9th, 2017 Task I 1.Three Types i.Data: Bar Chart, Line Graph, Table, Pie Chart ◆图表类型:动态图、静态图 ◆动态图:有两个或以上时间 ◆重点 ●趋势 ●特殊值:起点、重点、最高点、最低点、交叉点 ◆静态图:只有一个或者没有时间 ●比较描述对象:使用倍数、比较级 ii.Process: Flow Chart iii.Map ◆Describe the change ◆Eg: Hospital is located to the west of car park 2.评分标准 i.Task Achievement/ Task Response ◆Cover the Requirements of the task ◆No off topics ◆不能添加主观想法,只能描述 ii.Coherence and Cohesive ◆使用路标性词汇:顺承和转折 iii.Lexical Resource ◆使用非高频词汇 ◆Use words and phrases naturally and appropriately ◆Vocabulary diversity ◆Accurate spelling words iv.Grammatical Range and Accuracy ◆Accurate grammar of sentences ◆Use different ranges of sentences, structures to achiever grammatical 3.写作方法 i.开头段 ◆图表词改写 ●The chart : bar chart, line chart, pie chart, table, diagram ◆动词shows改写 ●注意时态 ●Shows: illustrates, gives information about, compares, indicates, demonstrates ◆关键词(一定要改写) ●数量改写 ?The number of + 可数 ?The amount of + 不可数 ?The quantity of + 可/不可数 ?The figure for +可/不可数 ●百分比改写
2014学年雅思写作真题
2014.1.9 The best way for government to solve the traffic congestion is to provide free public transport 24 hours a day, 7 da ys a week. To what extent do you agree or disagree? 小作文:表格 2014.1.11 Nowadays many young people in work force change their jobs or careers every few years. What do you think are the reas ons for this? Do the advantages outweigh the disadvantages? 小作文:流程图 2014.1.18 Many children find it is difficult to concentrate or pay at tention at school. What are the causes? What are the possible solutions to thi s problem? 小作文:曲线图+柱状图 2014.1.25 The international community should act immediatelyto reduce th e use of fossil fuels. To what extent do you agree or disagree? 小作文:饼状图 2014.2.1 Some people believe that the best way to produce a happier society is to ensure that there are only small differences between the richest and the poorest members. To what extent do you agree or disagree? 小作文:曲线图 2014.2.13
雅思写作小作文分类总结
雅思写作小作文分类总结 小作文一般都是图表作文,常见的几种主要类型有:表格图,曲线图,柱状图,饼状图和图画题五大类。一般来说,柱图和线图是每月常考的题型,有时候会有连考或者交替考的趋势。饼图和表格题也是相对频率较高的题型。偶尔也会考综合题。图画题主要分为流程图和地图题,一般每季度轮换题库的时候会出现。不管考到哪种题型,其要求都是一致的,先要挑选重要数值并且在相关处作比较。 在雅思A类小作文图表题的写作当中,考生经常会碰到图表看懂了,但因数据比较凌乱,找不出很明显的特征,或者找到了很多特征,却不知道应该用什么样的思路来把图表当中的重要信息和规律特征有机自然的联系贯穿起来的情况。今天文都国际教育小编将从动态图表和静态图表的角度来详细分析小作文的解题思路。 一、动态图 有时间推移变化的图我们通常叫做动态图。曲线图都是动态图,但是对于表格图,饼图和柱图却有动态和静态之分。对于大多数的动态图我们都可以大致当作线图来处理。动态图重点在数字变化的表达上,利用主语句型的不同和衔接关联词来展开。写好动态图的基础是要准备好三个方面: 1. 解题思路 1). 表格题的动态题解题思路大致可以分为四步:①先相减(年份大的减小的);②后分类(上升一类,下降一类);③挑出极值(最大值);④挑选数值(倍数关系,变化明显的数值); 2). 线图的解题思路大致分为两种:第一种:①按整条线来写(可以把相同趋势的线放在一起,也可把相反趋势的线拿来做对比);②挑选重要信息(整体趋势,起点,重点,最高点,最低点);③整体作比较。第二种:①按时间区间来写(横轴对上去有共同拐点或交点的分为一段);②对比着写(强调交点,拐点,最高点,最低点);
雅思小作文模板句必备50句型+
雅思小作文模板句必备50句型 A 1.the table shows the changes in the number of...over the period from...to... 该表格描述了在...年之...年间...数量的变化。 2.the bar chart illustrates that... 该柱状图展示了... 3.the graph provides some interesting data regarding... 该图为我们提供了有关...有趣数据。 4.the diagram shows (that)... 该图向我们展示了... 5.the pie graph depicts (that).... 该圆形图揭示了... 6.this is a cure graph which describes the trend of... 这个曲线图描述了...的趋势。 7.the figures/statistics show (that)... 数据(字)表明... 8.the tree diagram reveals how... 该树型图向我们揭示了如何... 9.the data/statistics show (that)... 该数据(字)可以这样理解... 10.the data/statistics/figures lead us to the conclusion that... 这些数据资料令我们得出结论... 11.as is shown/demonstrated/exhibited in the diagram/graph/chart/table... 如图所示... 12.according to the chart/figures... 根据这些表(数字)... 13.as is shown in the table... 如表格所示... 14.as can be seen from the diagram, great changes have taken place in... 从图中可以看出,...发生了巨大变化。 15.from the table/chart/diagram/figure, we can see clearly that...or it is clear/apparent from the chart that... 从图表我们可以很清楚(明显)看到... 16.this is a graph which illustrates... 这个图表向我们展示了... 17.this table shows the changing proportion of a & b from...to... 该表格描述了...年到...年间a与b的比例关系。 18.the graph, presented in a pie chart, shows the general trend in... 该图以圆形图形式描述了...总的趋势。 19.this is a column chart showing... 这是个柱型图,描述了...
2014年雅思A类写作真题以及模板全年汇总
雅思资料分享群:430104023(厦门) 2014年雅思A类写作真题全年汇总2014年雅思A类写作真题汇总: 2014.1.9 雅思写作真题(雅思A类写作) The best way for government to solve the traffic congestion is to provide free public transport 24 hours a day, 7days a week. To what extent do you agree or disagree? 2014.1.11 雅思写作真题(雅思A类写作) Nowadays many young people in work force change their jobs or careers every few years. What do you think are the reasons for this? Do the advantages out-weight disadvantages? 2014.1.18 雅思写作真题(雅思A类写作) Children find it difficult to concentrate on or pay attention to school. What are the reasons? How can we solve this problem? 2014.1.25 雅思写作真题(雅思A类写作) International community should act immediately to encourage countries to reduce the consumption of fossil fuels, such as oil and gas. To what extent do you agree or disagree? 2014.2.1 雅思写作真题(雅思A类写作) Some people believe that the best way to produce a happier society is to ensure that there are only small differences between the richest and the poorest members. To what extent do you agree or disagree? 2014.2.13 雅思写作真题(雅思A类写作) Towns and cities are attractive places. Some suggest the government should spend money putting in more works of art like paintings and statues to make them better to live in. Do you agree or disagree? 2014.2.15 雅思写作真题(雅思A类写作) Some people think success of life is based on hard work and determination but others think there are more important factors like money and appearance. Discuss both views and give your own opinion.
雅思小作文真题汇总
2016年1月9日雅思写作真题之雅思小作文TASK1 男女同学在课外参加体育运动的时常比例。 difference in the percentage of sports in outdoor school hours 2016年1月14日雅思写作真题之雅思小作文TASK1 The number of people taking part in a wildlife survey in Britain between 2001 and 2009. 2016年1月23日雅思写作真题之雅思小作文TASK1 The three pie charts below show the production, consumption of coffee and where the profit goes around the world.
(数据仅供参考)
2016年1月30日雅思写作真题之雅思小作文TASK1 Task 1 The diagram shows how an office building looks at present and the plan for its future development. 2016年2月18日雅思写作真题之雅思小作文TASK1
Changes of average monthly salary and prices of black and white TV in Japanese Yen from 1953 to 1973 2016年2月20日雅思写作真题之雅思小作文TASK1 The chart and graph show the categories of workforce in Australia and the unemployment within 3 groups.
相关文档
- 历年雅思写作真题
- [实用参考]2014-2015年雅思大作文题目汇总
- 历年雅思写作真题
- 2014年雅思写作真题
- 2017年雅思写作真题
- (完整word)2014年雅思A类大作文题目汇总,推荐文档
- 2014年雅思A类写作真题以及模板全年汇总
- 历年雅思写作真题
- 2017年雅思写作真题小作文.doc
- 2013年雅思写作真题范文
- 2017年雅思写作真题-10月
- 2014年雅思大作文真题汇总(经典)
- 13--14 年ielts雅思大作文真题
- 17年雅思写作真题汇总.
- 历年雅思写作真题
- 2014学年雅思写作真题
- 2014年雅思A类大作文题目汇总
- 2017年雅思写作真题1-11月
- 2014年雅思写作真题
- 2014年雅思2月13日雅思真题写作全科回忆及解析